

Since 2014, Trading Made Easy has been dedicated to a clear mission: simplifying the complexities of the trading world for everyone. We believe in providing powerful, accessible tools that help traders navigate the markets with confidence.
Let's start with one of the most classic signals in a trader's toolkit: the double top pattern.
Picture a mountain climber trying to conquer a peak. He makes a strong push up, gets near the top, but has to retreat. After gathering some strength, he tries for the summit again, only to be turned back at the very same spot. That exhaustion and failure to push higher is exactly what the double top shows on a price chart. It's a clear 'M-shaped' formation that often signals an uptrend is running out of gas, and a drop could be coming.
Understanding the Double Top Pattern

When you see a double top, it's like a big, flashing warning sign. It’s a visual cue that the buyers who were enthusiastically pushing the price up are losing control, and sellers are starting to step in with force. This pattern usually shows up after a solid run-up in price, telling you the asset has hit a ceiling—a resistance level it just can't seem to break.
Why is this so important? Because it gives you a heads-up that the trend might be about to flip. The pattern gets its signature "M" shape from two key parts:
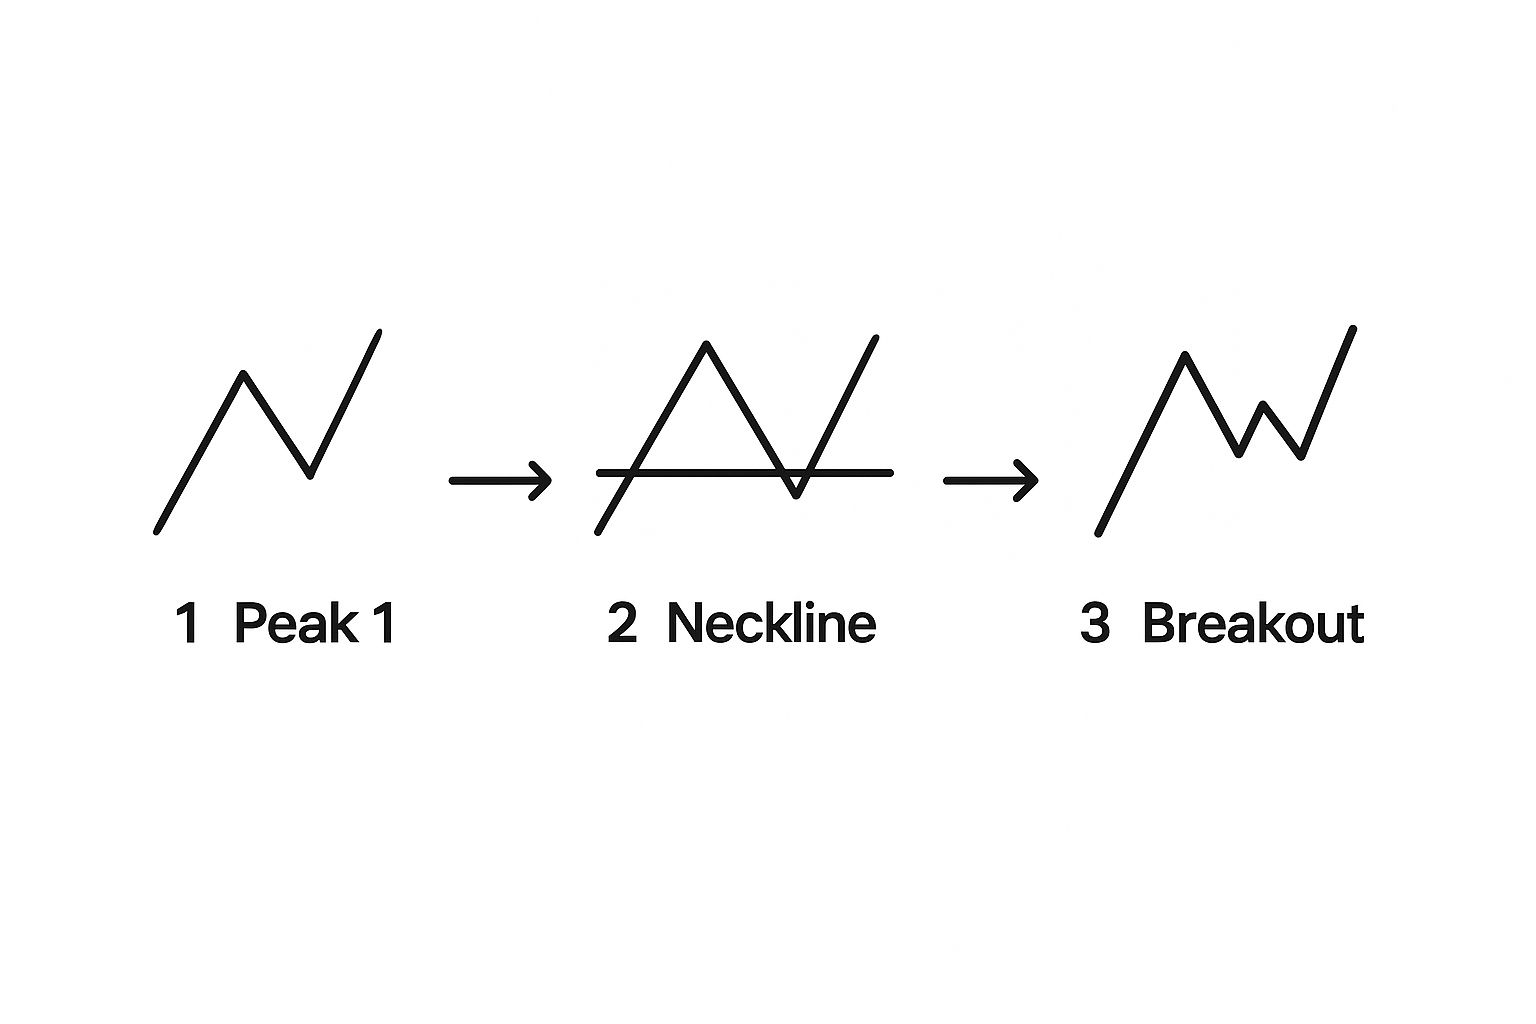
- Two Back-to-Back Peaks: The price rallies to a high, pulls back, and then rallies again to roughly the same high point. Think of these two peaks as a firm ceiling, or resistance.
- A Valley in the Middle: That dip between the two peaks forms a support level we call the neckline. This line is the real key.
The pattern isn't confirmed until the price breaks below that neckline. Once that happens, it’s a strong signal that the uptrend is likely over and a new downtrend is getting started.
Real-World Examples of This Pattern
This isn't just a textbook theory; the double top plays out all the time in real markets. You can spot it on everything from individual stocks to major currency pairs.
For example, Zoom Video Communications Inc (ZM) formed a textbook double top on its daily chart. The stock pushed up to a resistance level twice before it finally rolled over into a significant downtrend. It was a classic case of buyer exhaustion.
It happens in the Forex market, too. The GBP/USD currency pair showed a clear double top on its weekly chart after a long, multi-week bullish run. If you want to see more of these in action, you can explore more chart pattern examples and their outcomes to really sharpen your eye.
This gives you the foundation you need. Now, let's get into the specifics of how to spot it, trade it, and manage your risk like a pro.
Anatomy of the Double Top Pattern
To really get a handle on this classic reversal signal, you need to understand its individual parts and the story they tell about what's happening in the market. A double top isn't just a random "M" shape on your chart; it’s a play-by-play of a fierce battle between buyers and sellers, where the buyers ultimately lose their grip.
The whole formation unfolds in a specific sequence. Each part gives you a clue that the strong uptrend you've been watching is starting to run out of gas.
Think of it like a four-act play.
Act I: The Initial Uptrend and First Peak
The story always kicks off with a solid uptrend. The price has been climbing steadily, carving out higher highs and higher lows. Everyone feels good about the market. This bullish energy eventually pushes the price to a new high, which forms the first peak.
This peak is where the buying pressure finally hits a wall of resistance. The rally stalls as sellers start to step in or early buyers decide to take their profits off the table.
Act II: The Pullback and Neckline Formation
After hitting that first peak, the price pulls back. This little dip creates what we call the neckline, which is just a crucial support level.
The neckline is the floor of the pattern. It’s the price where buyers decided to jump back in and defend the uptrend, stopping the decline for a moment. This valley between the two peaks becomes a critical reference point for confirming the pattern later on.
This visual shows you exactly how that tug-of-war between buyers and sellers plays out, ending with that decisive break of the neckline which seals the deal.
Act III: The Second Peak and Buyer Exhaustion
Once the price finds support at the neckline, buyers give it another shot. They try to push the price back up toward that previous high, which creates the second peak.
Here’s the critical part: this second push often happens on weaker volume than the first one. It’s a subtle but powerful sign that the conviction just isn't there anymore. The fact that they couldn't break above the first peak is a massive red flag. It shows the buyers have simply run out of steam.
The second peak's failure to make a new high is the single most important sign of weakness in a double top. It proves the initial bullish momentum is gone, and sellers are now strong enough to hold that resistance level.
Act IV: The Neckline Break and Confirmation
This is the final act, and for traders, it’s the most important one.
After getting rejected at that second peak, the price tumbles again, this time heading right back to the neckline. The double top pattern is only officially confirmed when the price breaks below this neckline support.
This break tells you the sellers have won the fight. The old uptrend is finished, and a new downtrend is probably just getting started. The individual candles that form during this break are also packed with information; you can learn more by checking out our guide on candlestick patterns for beginners.
How to Confirm and Trade the Double Top
So, you’ve spotted that classic M-shape on your chart. It looks like a double top, and your finger is hovering over the "sell" button. Hold on.
Jumping the gun on a pattern that looks like a double top is one of the quickest ways to get burned. Seeing the pattern is just step one. The real key to trading it successfully is waiting for confirmation.
And the single most important confirmation signal? A clean, decisive price close below the neckline.
This isn't just about the price wicking below for a moment; we're looking for a firm, committed break. Think of that neckline as a line in the sand. When the price snaps below it, it's a clear signal that the sellers have wrestled control away from the buyers who were holding that support level.

This isn’t just trading folklore, either. The data backs it up. Extensive research on chart patterns has shown just how reliable this specific signal is. A well-known study by Thomas Bulkowski, for instance, found that the double top has about a 73% success rateafter the neckline breaks. That means almost three-quarters of these formations lead to a real, measurable price drop. If you want to dive into the numbers yourself, you can explore the research on chart pattern success rates.
Adding Layers of Confirmation
While the neckline break is your go-to trigger, the sharpest traders don't rely on just one signal. They build a case for their trade, stacking evidence to increase their odds.
Two of the most powerful tools for this are:
- Trading Volume: Look for a big spike in selling volume right as the price crashes through the neckline. This tells you there’s real conviction behind the move—it’s not just a fake-out. The downward momentum has fuel.
- Momentum Oscillators: Indicators like the Relative Strength Index (RSI) can give you a heads-up. You might see a bearish divergence, where the price makes a second, higher peak, but the RSI makes a lower peak. This is a huge clue that the buying momentum is already fading, even before the price officially breaks down.
A Practical Checklist for Entry
To turn this analysis into a repeatable strategy, you need a simple checklist. This helps you trade a high-probability setup instead of just chasing shapes on a chart.
- Identify the Two Peaks: First, confirm you have two clear peaks at roughly the same resistance level.
- Locate the Neckline: Next, draw a horizontal line at the lowest point of the valley sitting between those two peaks.
- Wait for the Break: This is where patience pays off. Don't do anything until a candle closes firmly below that neckline.
- Check for Confirmation: Finally, glance at your indicators. Do you see a surge in volume on the breakout? Is there a bearish divergence on the RSI?
By following this simple, structured approach, you turn the double top pattern from a guess into an actionable trading strategy with a crystal-clear entry signal. It’s how you filter out the noise and start trading with more consistency.
Setting Price Targets and Managing Risk
Spotting a confirmed double top pattern is a great start, but that's really only half the job. To actually make money from it consistently, you need a solid plan for managing your risk and locking in your profits. Without those two pieces, even the most perfect-looking setup can quickly turn into a costly mistake.
The first rule in any trading strategy is knowing your exit point if the trade moves against you. This is your stop-loss order. Think of it as your financial safety net, protecting your account from taking a major hit.
For a double top, the most intuitive place for a stop-loss is just a little bit above the second peak. By placing it there, you're essentially saying, "If the price musters the strength to break above this powerful resistance level it just failed at, I was wrong about the pattern." You'll get taken out of the trade for a small, controlled loss.
Projecting Your Profit Target
Once your risk is locked down, you need to decide where you'll take your profits. Just guessing or closing a trade based on a gut feeling is a surefire way to get inconsistent results. Luckily, the double top pattern gives us a straightforward, built-in way to project a logical target.
It’s a simple two-step process based on the height of the pattern itself.
- Step 1: First, measure the vertical distance from the highest peak of the pattern straight down to the neckline.
- Step 2: Next, take that same distance and project it downwards, starting from the point where the price officially broke through the neckline.
That projected level is now your primary profit target. It's a methodical approach that uses the pattern's own volatility and structure to define a reasonable exit point.
This price projection technique gives you a complete trade plan. You have a clear entry (the neckline break), a defined exit for a loss (the stop-loss), and a specific goal for taking profit, removing guesswork from your execution.
Creating a Complete Trade Plan
When you put all these pieces together, you have a structured game plan for every trade. You know your entry signal, your maximum acceptable loss, and your potential reward before you ever click the "buy" or "sell" button. This kind of framework is crucial for staying disciplined, particularly for active traders who have to navigate strict regulations. For more on that, our article on understanding the pattern day trader rules offers some valuable insights.
By setting these clear rules ahead of time, you shift from being a reactive, emotional trader to a proactive, strategic one. That discipline is what truly separates traders who find long-term success from those who don't. It turns a simple chart pattern into a complete, repeatable trading system.
Common Mistakes When Trading This Pattern

As powerful as the double top pattern can be, it's definitely not foolproof. I've seen countless eager traders spot that classic "M" shape, rush into a short position, and then get wiped out when the price whipsaws right back up through their stop-loss.
Honestly, knowing what not to do is just as critical as recognizing the pattern itself.
The Pitfall of Jumping the Gun
The single biggest mistake traders make? Acting too soon. I get it—the second peak forms, and the temptation to short the market is huge. But that's a gamble, not a strategy.
The pattern isn't truly confirmed until the price closes decisively below that neckline. Anything before that is just you betting that the pattern will complete. It's a classic case of front-running the market, and it rarely ends well.
Another massive error is ignoring the bigger picture. In a choppy, directionless market, you'll see "M-like" shapes everywhere. But these aren't true double tops. A real double top needs a strong, established uptrend to reverse. Without that initial bullish fuel, the pattern just doesn't have the same predictive punch.
Why Patience and Volume Are Everything
In trading, patience is more than a virtue; it's your greatest asset. This is especially true with reversal patterns like the double top. If you enter prematurely, you’re completely exposed. The price could easily grind higher for a third peak or just consolidate sideways, leaving you stuck in a losing trade.
Think of the neckline break as the market's official announcement that the sellers have seized control. If you trade before that signal, you're trying to outsmart the market's decision—a high-risk, low-probability move.
Volume is the other piece of the puzzle that so many traders miss. A real, convincing breakdown below the neckline should happen on a big spike in selling volume. That surge tells you there's real conviction behind the move.
If the price just sort of drifts below the neckline on weak, pathetic volume? That’s a huge red flag for a "fakeout" or a false break.
A Reality Check on Reliability
It's vital to be realistic about the double top pattern. While it's a solid indicator, it's not a crystal ball. Looking at the historical data gives us a much-needed dose of perspective.
To put some hard numbers on this, a comprehensive backtest study looked at 500 stocks over a five-year period from 1991 to 1996. Here’s a breakdown of what they found.
Double Top Pattern Reliability Breakdown
| Metric | Finding |
|---|---|
| Reversal Signal | 75% of double tops resulted in a bearish reversal. |
| Target Achievement | Only 39% of those reversals reached their projected price target. |
| False Signal Rate | A significant 17% of patterns were false signals. |
You can dig deeper into these statistical findings on double top reliability yourself.
What this data tells us is pretty clear: the pattern is quite good at flagging a potential reversal, but it’s only moderately reliable when it comes to hitting its full price target. This is precisely why automated systems, like the one we've built at Trading Made Easy, use a strict combination of rules and confirmations. We filter out the noise to focus only on the highest-probability setups.
By understanding and avoiding these common mistakes, you can build a much smarter and more resilient approach to trading this classic pattern.
Double Top vs Double Bottom Patterns
To really get good at spotting reversals, you need to know the difference between the bearish double top and its bullish counterpart, the double bottom. They’re essentially mirror images of each other, but they tell completely opposite stories about market sentiment.
Think of them as two sides of the same coin. One signals that the party is ending for the bulls, while the other suggests the bears are finally running out of steam.
The double top looks like a capital "M" and usually shows up after a nice, strong uptrend. It's a big red flag. It tells us that buyers tried—not once, but twice—to break through a key price ceiling and failed. Their momentum is gone.
On the flip side, the double bottom forms a "W" shape after a sustained downtrend. This pattern suggests sellers have repeatedly tried to push the price lower and couldn't break through a floor of support. It's a sign that the bears are losing their grip, and buyers might be about to step in.
Core Structural Differences
The psychology behind these patterns is a classic tale of failed optimism versus resilient hope. A double top is born when confidence shatters. A double bottom emerges when the market refuses to sink any lower.
Let's break down the key differences in a simple table so you can instantly tell them apart on a live chart.
Double Top vs Double Bottom Key Differences
This quick comparison highlights the defining features of each pattern, making it much easier to remember which is which when you're analyzing a chart under pressure.
| Characteristic | Double Top (Bearish) | Double Bottom (Bullish) |
|---|---|---|
| Preceding Trend | Forms after a clear uptrend. | Forms after a clear downtrend. |
| Shape | Resembles the letter "M". | Resembles the letter "W". |
| Key Level | Confirmed by a break below the neckline (support). | Confirmed by a break above the neckline (resistance). |
| Market Signal | Indicates sellers are taking control. | Indicates buyers are taking control. |
Seeing them side-by-side like this really clarifies things. One is a signal of impending weakness, the other a sign of budding strength.
Of course, identifying the pattern is only half the battle. How you enter the trade is just as important. Knowing when to use different order types is fundamental to executing your strategy effectively. If you need a refresher, check out our guide comparing a market order vs a limit order.
By getting comfortable with both the double top and the double bottom, you’ll be ready to spot major turning points no matter which way the market is headed.
Automate Your Strategy with Trading Made Easy
Mastering chart patterns like the double top is a crucial step, but what if you could ensure every setup was executed with machine-like precision? This is where automation can transform your trading.
At Trading Made Easy, our patented, AI-driven day trading software is designed to turn your knowledge into automated action. It takes the principles of technical analysis and applies them without emotion or hesitation.
Unique Features of Our Automated Software
Our system is engineered to solve the most common trading challenges: emotional decision-making and human error. Here’s what makes it different:
- Emotion-Free Execution: The software operates strictly on your predefined rules, eliminating trades based on fear or greed.
- 24/7 Market Scanning: It tirelessly scans multiple futures markets, ensuring you never miss an opportunity, even when you're away from the screen.
- Lightning-Fast Speed: By executing trades up to 1,000 times faster than a human, our system can capitalize on fleeting market movements that are impossible to catch manually.
- Disciplined Risk Management: Every trade includes automated stop-loss and profit-target orders, enforcing a disciplined strategy on every single position.
Success with Automation: A Real-World Example
The impact of this technology is best seen through our clients. Consider a busy professional who couldn't dedicate his day to watching charts. Our software identified a classic double top pattern forming on a major index future.
Without any manual intervention, the system detected the neckline break, entered a short position, and secured the profit at the pre-calculated target—all while our client was focused on his job. This is the power of combining solid trading logic with disciplined automation. Stories like this demonstrate how our software helps traders apply their strategies consistently and effectively.
Conclusion: Trade Smarter, Not Harder
Understanding the double top pattern is a powerful skill. Automating the execution of that skill is the next evolution in trading. By removing emotion, increasing speed, and ensuring discipline, you can focus on strategy rather than the mechanics of placing every order.
We invite you to explore the innovative solutions at Trading Made Easy. See how our automated software can help you trade with greater consistency and confidence. Learn more at https://tradingmadeasy.com.
Leave a Reply