When you're scanning charts, some patterns jump out more than others. The M pattern is one of them. Since 2014, our mission at Trading Made Easy has been to take complex trading strategies and make them clear and actionable. This guide continues that mission by breaking down one of the most reliable bearish reversal signals in technical analysis.
In simple terms, the M pattern is a visual red flag shaped like the letter 'M' that signals a stock's upward run might be losing steam. Spotting it correctly can give you a heads-up to consider a short position before the rest of the market catches on.
Decoding The M Pattern In Modern Trading
We're diving into one of the most reliable chart formations out there: the M Pattern, which you'll also hear called the Double Top. Think of it like a story unfolding on your screen. An asset is in a solid uptrend, and buyers are feeling good, pushing the price higher and higher. It hits a peak, but then sellers start to emerge, and the price dips.
The buyers, not ready to give up, try to rally again. But here's the key: they run out of gas right around the same price level as that first peak. This second failed attempt to push higher forms the other half of the 'M' and is a huge tell. It shows the buying pressure is fading and the sellers are starting to take charge.
The Core Components Of The M Pattern
So, what are the pieces that make up a true M pattern? You have to see all the parts line up for the signal to be valid. It's more than just a vague shape; it’s a specific sequence of events.
The table below breaks down the essential anatomy of the M pattern. Learning these components is the first step to confidently identifying this setup in a live market.
| Anatomy of the M Pattern |
|---|
| Component |
| Prior Uptrend |
| First Peak |
| The Valley (Trough) |
| Second Peak |
| Neckline Break |
Each of these stages tells you something about the battle between buyers and sellers. When you see them all play out in order, you're getting a clear message from the market.
The M pattern fundamentally represents a struggle at a key resistance zone. The failure to make a higher high on the second peak is the market telling you the uptrend is likely finished.
Why This Pattern Matters
For a trader, the M pattern isn't just an interesting blip on a chart—it's a concrete, actionable strategy.
It gives you a clear trigger for a potential short trade and comes with a built-in game plan. You have a logical spot for your stop-loss (just above the two peaks) and a way to measure a potential profit target. While it's powerful, its accuracy gets a serious boost when you pair it with other signals, like a spike in trading volume on the neckline break. For more detail on the M Pattern specifically, Market-Bulls.com offers some great insights.
Learning chart patterns like this is a fundamental skill. It’s a great next step after you've gotten comfortable with the basics, like those we cover in our guide to candlestick patterns for beginners. Mastering these formations helps you anticipate what the market might do next, rather than just reacting after the fact.
Alright, let's move from the textbook diagrams to the real world. This is where the rubber meets the road—spotting an M pattern on a live, fast-moving chart. It’s one thing to see a perfect 'M' in a drawing, but it's a completely different ball game in the heat of the moment.
Honestly, real-world charts are messy. They're choppy, and patterns are rarely picture-perfect. Success here isn't about finding a symmetrical masterpiece. It's about training your eye to see the key building blocks of the pattern as they form in real-time. Think of this as your field guide for navigating the markets.
First, Look for the Right Setup
An M pattern is a reversal pattern. That means it can only happen if there's an existing trend to reverse. So, the absolute first thing you need to see on the chart is a clear, established uptrend. No uptrend, no M pattern. It's that simple.
You should be able to easily spot a series of higher highs and higher lows right before the pattern starts. Trying to find an M pattern in a sideways, range-bound market is a classic rookie mistake and a recipe for getting chopped up by false signals.
Here's a pro tip: The best M patterns often form after a long, strong rally starts to look tired. If you see momentum fading on those last pushes higher, that's the perfect environment for a powerful reversal to take shape.
Pinpoint the Key Landmarks
Once you've confirmed you're in an uptrend, it's time to zero in on the price action. You're looking for a few specific landmarks that build the 'M' structure.
The First Peak: This is the high point where the rally stalls out. Sellers step in with enough force to stop the buyers cold, establishing a key resistance level.
The Valley (Neckline): After hitting that first peak, the price pulls back. The low point of this pullback creates a temporary support level we call the neckline. This level is absolutely critical for timing your trade later on.
The Second Peak: Buyers give it one more shot, pushing the price back up towards the first peak. The magic happens when they fail to break through and make a new high. This second peak might be a little lower, equal to, or even slightly higher than the first, but it gets rejected. That failure is a huge red flag for the bulls.
The real story of the M pattern is told at that second peak. When the market can't push past its prior high, it's a screaming signal that the buyers have run out of gas and the sellers are taking over.
Use Volume to Confirm What You're Seeing
Volume is your truth detector. It shows you the conviction behind the price moves and can help you avoid fake-outs.
For a textbook M pattern, here’s what the volume story should look like:
- You want to see strong volume during the uptrend that creates the first peak.
- Then, watch for decreasing volume as the price rallies up to the second peak. This is a dead giveaway that buyers are losing interest.
- The final confirmation is a big spike in volume as the price breaks below the neckline. That surge tells you sellers are now in firm control.
Imagine a stock runs up to $50 (first peak) on heavy volume. It pulls back to $47 (the neckline) on lighter volume. As it tries to rally back toward $50, you notice the volume is noticeably weaker than the first time around. That’s your cue. If the price then rolls over and crashes through $47 with a huge burst of selling volume, you’ve got a high-confidence M pattern on your hands.
Executing The M Pattern Trade: A Disciplined Game Plan
Spotting a potential M pattern is a great start, but it's only half the game. I've seen countless traders get excited and jump the gun, only to watch the trade turn against them. A perfect identification means nothing without a rock-solid, disciplined plan for execution.
This is where patience becomes your most valuable asset.
When you see that second peak forming, the urge to short the market can be overwhelming. But experienced traders know this is a classic mistake. The pattern isn't confirmed—it's not real—until the price breaks decisively below the support level formed by that middle valley. We call this the neckline. Waiting for that confirmation is the single best thing you can do to stack the odds in your favor.
Setting The Stage For Your Trade
Executing an M pattern isn't about guesswork; it's a structured process that removes emotion from the equation. In practice, I follow a clear set of rules for any potential M pattern trade.
It starts with an existing uptrend. Then, I look for a major swing high that sets a resistance level. After a pullback, the price tries to re-test that high but ultimately fails to break through. The final, and most crucial, step is waiting for the price to crash below the neckline before I even think about entering. This confirms the M shape and signals the bears are likely taking control.
This simple, rule-based approach turns a chart shape into a high-probability entry signal. For a deeper dive into these rules, you can check out this great resource on pattern trading from xabcdtrading.com.
This chart breaks down the flow perfectly, from spotting the pattern to pulling the trigger.
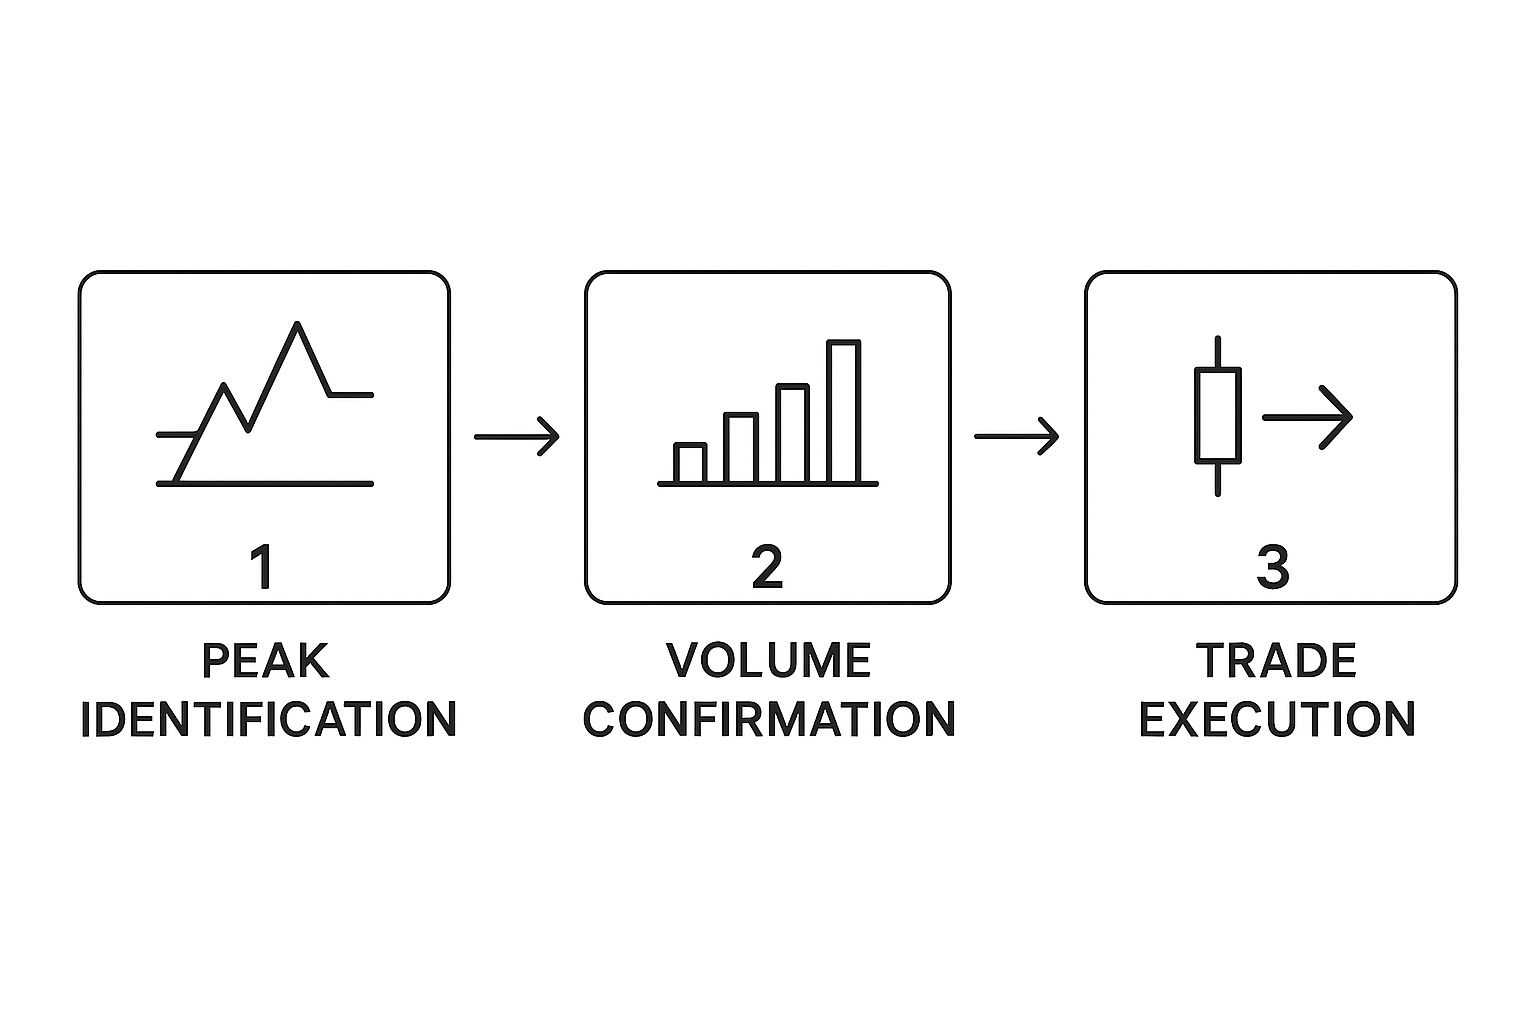
As you can see, the execution is the very last step—something you only do after careful identification and confirmation.
Protecting Your Capital With A Smart Stop-Loss
The moment you're in the trade, your number one job is risk management. A stop-loss order isn't optional; it's your safety net.
For an M pattern, the logic is straightforward. The best place for your stop-loss is just above the high of the second peak.
Here’s why that specific spot makes sense:
- It’s the Invalidation Point: If the price reverses and pushes above that second peak, the whole bearish setup is wrong. Simple as that.
- It Gives You a Clear Exit: This prevents you from holding a losing trade based on hope, which is a surefire way to blow up your account.
- It Defines Your Risk: You know exactly how much you stand to lose before you even enter the trade.
Let's say a stock forms an M pattern with peaks around $105 and a neckline at $100. You'd go short as the price breaks below $100. Your stop-loss could be placed at $105.25, giving it just a little breathing room above that resistance.
A well-placed stop-loss isn’t a sign you expect to lose. It's the mark of a professional who plans for every outcome and intends to stay in the game for the long haul.
Setting Realistic Profit Targets
Okay, so your risk is locked down. Now for the fun part: where do you take profits?
A simple and incredibly effective technique is to use the pattern’s own dimensions to project your target.
Here’s the two-step process:
- Measure the Pattern's Height: Calculate the distance from the highest peak down to the neckline.
- Project That Distance Downward: Subtract that height from the neckline's price. This gives you a data-driven price target for your short position.
Using our last example: the peak was $105 and the neckline was $100, giving the pattern a height of $5. Subtract that $5 from the $100 neckline, and you get a logical profit target of $95. This method keeps you from closing a winning trade too early out of fear or getting greedy and watching it reverse.
Just remember, your trading frequency can be impacted by certain regulations. It's always a good idea to stay current on the pattern day trader rules to make sure you're trading within the guidelines.
Automate Your Strategy with Trading Made Easy

Let's be honest. Finding, confirming, and trading an M pattern takes a ton of focus and screen time. Staring at charts for hours is a fast track to burnout and missed opportunities. This is where smart tools give you a real edge. At Trading Made Easy, our automated day trading software is built on a simple idea: let technology do the grunt work so you can make smarter decisions.
Our platform has several unique features designed to take the guesswork and emotional rollercoasters out of M pattern trading:
- Automated Scanners: Instead of you hunting for setups, our software scans the entire market based on your specific rules. You get instant alerts when a high-probability M pattern is forming, freeing you from being glued to your monitor.
- Visual Chart Overlays: The platform draws the pattern’s peaks and neckline directly on your chart. This removes subjectivity and instantly confirms the pattern's geometry, so you're not left squinting and wondering if a setup is valid.
- Data-Driven Backtesting: This is our most powerful feature. Before risking a single dollar, you can test your M pattern strategy against years of historical data. This lets you validate your approach, optimize your rules, and build genuine confidence backed by statistical proof.
By automating the discovery and validation process, our software helps you sidestep emotional traps and forces a level of discipline that’s tough to maintain on your own. It puts you back in control, armed with better, faster, and more reliable information.
Success Stories: Real Results from Traders
Theory is great, but seeing how our tools help traders in the real world is what really matters. These are examples of how our software helps overcome common roadblocks like missed trades and analysis paralysis.
From Frustration to Profit: A Trader’s Story
Take 'Trader J,' a retired vet who was burning out staring at charts. He knew the M pattern strategy but hesitated on live charts, often missing perfect setups. He began using our automated scanner, setting it to alert him only when an M pattern met his strict criteria.
One morning, an alert popped up for a perfect M pattern on a major index future. The software laid it all out on his chart, erasing any doubt. Seeing the setup confirmed by his own rules, he took the trade with confidence. It became one of his biggest wins of the year. He later told us, “The software didn't make the decision for me. It just did the heavy lifting. It found the needle in the haystack so all I had to do was execute my plan.”
Building Confidence with Data
Then there's 'Trader M,' a cautious accountant who was skeptical of subjective chart patterns. Her breakthrough came from our backtester. She plugged her M pattern rules into the system and ran them against five years of historical data. The results gave her the cold, hard data she craved: the strategy's historical win rate, average risk-to-reward, and potential drawdowns. Armed with this statistical proof, her entire mindset shifted. She was no longer guessing; she was executing a plan she had personally validated. The backtester gave her the confidence to trade without hesitation, turning her analysis paralysis into decisive action. You can dig into similar academic research yourself over at J.P. Morgan's tech blog.
Putting Your M Pattern Knowledge Into Action

We've walked through the essentials of a successful M pattern trading strategy: finding the trend, spotting the peaks and neckline, and waiting for confirmation. This discipline separates sporadic wins from consistent results. But doing all this manually in a fast-moving market is tough. That’s the problem our automated day trading software was designed to solve.
At Trading Made Easy, we deliver tools that do the heavy lifting for you—scanning markets, pointing out high-probability M patterns based on your rules, and letting you test ideas against historical data. This isn’t about replacing your judgment; it’s about giving you the speed and accuracy to back it up. We’ve seen firsthand how this helps traders build confidence and achieve more consistent results.
Your next successful trade could start with having the right tools. The market won’t wait, and with the right support, you can act decisively when opportunity appears. I encourage you to see for yourself how our platform can simplify your entire process.
Check out a demo of our software and explore the offerings from Trading Made Easy.
M Pattern FAQs: Your Top Questions Answered
When you start digging into the M pattern, a few common questions always seem to pop up. It’s completely normal. Let's walk through some of the most frequent sticking points so you can feel more dialed-in when you see this setup on your charts.
What's the Difference Between an M Pattern and a Double Top?
I get this one all the time. The short answer? There isn't one. They're two names for the exact same formation.
"Double Top" is the classic textbook term that's been around forever. "M Pattern" is just a more modern, descriptive name that helps you instantly picture that signature shape. It's all about recognizing the visual cue on the chart.
Is the M Pattern Actually a Reliable Signal?
This is the big one, isn't it? The truth is, no single pattern works 100% of the time. If it did, we'd all be retired on a beach somewhere. But the M pattern is absolutely considered a solid bearish reversal signal when you know what to look for.
The key is to never trade it in a vacuum.
Think of it this way: seeing the pattern form is the first clue. Seeing a huge spike in selling volume as the price breaks the neckline? That’s your confirmation. It tells you that sellers aren’t just testing the waters; they're jumping in with conviction. To really stack the odds in your favor, understanding how to identify market trends is crucial, as it gives you the bigger picture of why a reversal might be imminent.
An M pattern becomes a high-probability setup when it's part of a larger story—an exhausted uptrend, failing buying momentum, and a surge of selling pressure at the confirmation point.
Which Markets and Timeframes Work Best?
Finally, people often ask if this pattern is specific to stocks or forex. Not at all. The M pattern is rooted in market psychology—the universal tug-of-war between buyers and sellers. You'll see it play out in stocks, crypto, forex, and commodities.
It works best in liquid markets where you get clean, defined trends. This allows the pattern’s story of a failed rally to unfold clearly.
As for timeframes, you can spot an M pattern on anything from a 5-minute chart to a weekly one. From my own experience, though, they tend to be far more reliable on longer timeframes, like the 4-hour or daily. A pattern forming over several days or weeks simply carries more weight because it represents a much more significant and deliberate shift in market sentiment.
At Trading Made Easy, our entire mission is to take this kind of complex analysis off your plate. Our automated software is designed to find these patterns, validate them against key criteria, and give you clear, actionable signals so you can stop guessing.
Discover how Trading Made Easy can transform your trading strategy today.
Leave a Reply