Ever stepped into a foreign currency exchange booth? You'll notice they have two prices for every currency: a "we buy" price and a "we sell" price. The gap between those two numbers is how they make their money. The stock market works on the exact same principle, and that gap is called the bid-ask spread.
Here at Trading Made Easy, we've been dedicated to demystifying the markets for traders like you since 2014. Our mission is simple: to make sophisticated trading accessible to everyone, not just the pros on Wall Street. Understanding concepts like the bid-ask spread is the first step on that journey.
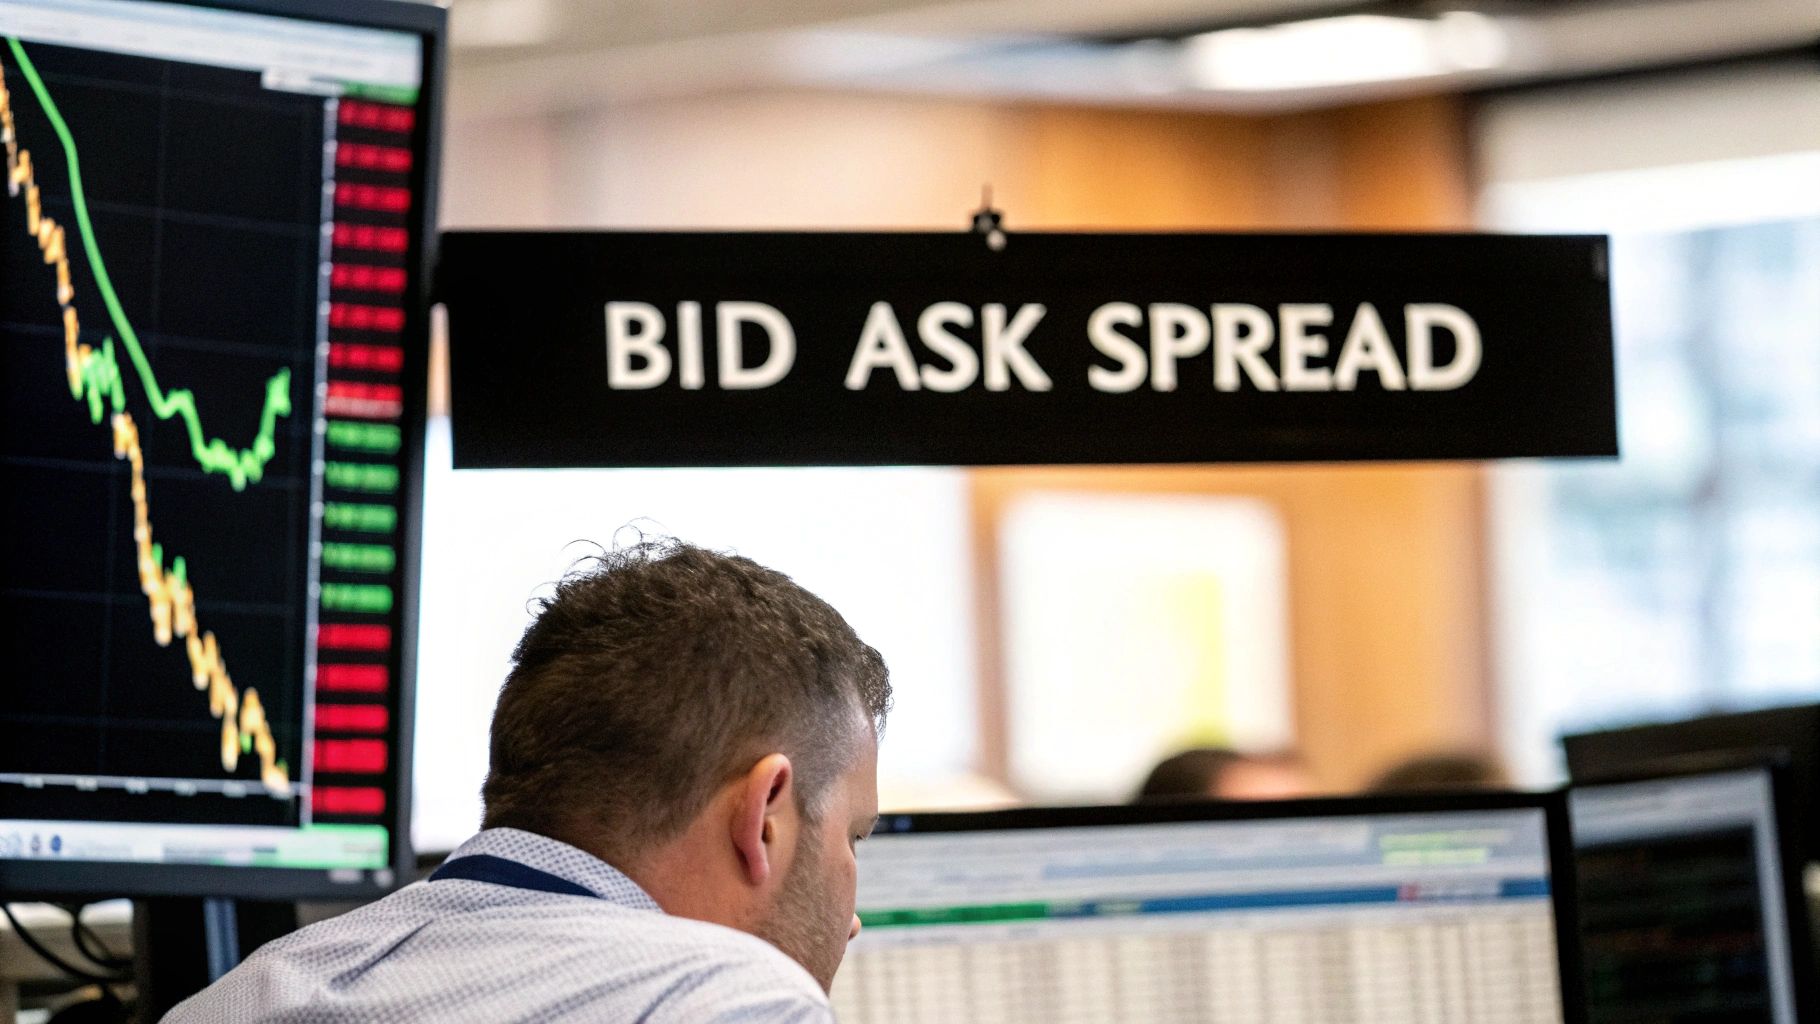
Your Essential Introduction to the Bid Ask Spread
Think of the spread as the built-in cost of trading. It's the difference between the highest price a buyer is willing to pay for a stock (the bid) and the lowest price a seller is willing to accept for it (the ask). This small difference is fundamental to every single trade you'll ever make.
The spread is essentially the profit margin for "market makers." These are the large financial institutions that provide the liquidity for the market to function smoothly, standing ready to buy from sellers and sell to buyers at any moment. The spread is their compensation for providing this service.
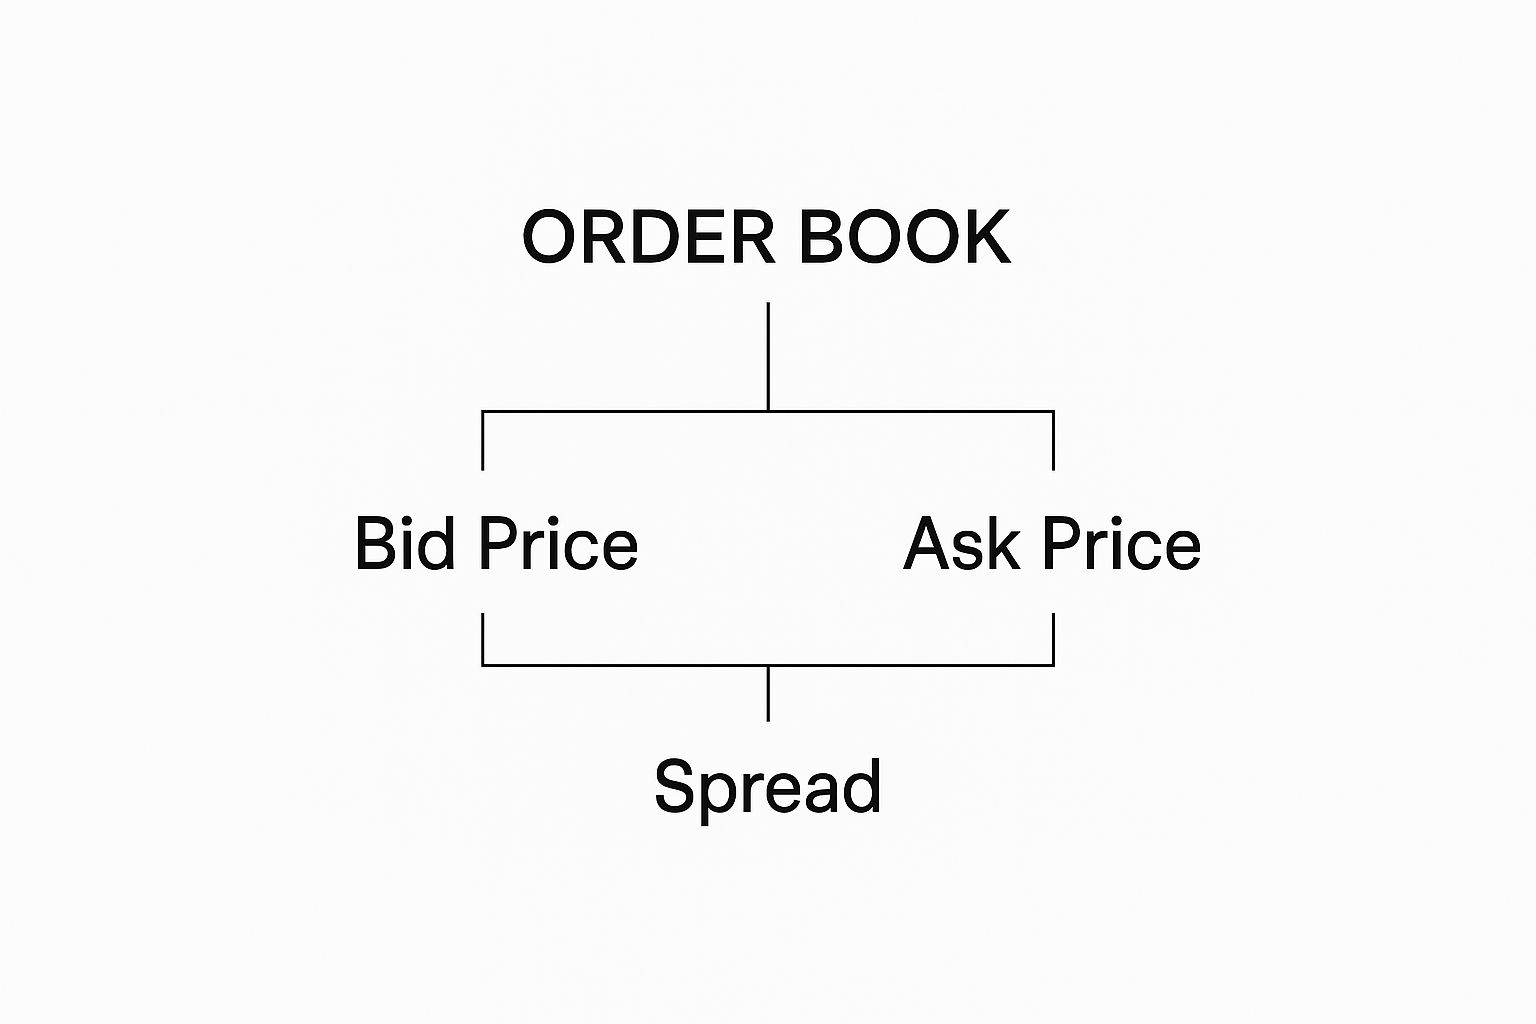
Breaking Down Bid vs. Ask
To truly get a handle on this, you need to see it from a trader's perspective. The bid and ask prices aren't just numbers on a screen; they represent what you can actually do in the market right now.
The table below breaks down what each term means and how it directly impacts your trading decisions.
Bid vs Ask at a Glance
| Term | What It Means | From a Trader's Perspective |
|---|---|---|
| Bid Price | The highest price any buyer is currently offering for the asset. | This is the price you get if you sell your shares right now. |
| Ask Price | The lowest price any seller is currently offering for the asset. | This is the price you pay if you buy shares right now. |
Essentially, you always buy at the higher price (the ask) and sell at the lower price (the bid).
This means that for you to break even on a trade, the stock's price has to move in your favor enough to cover the spread. If you buy a stock at an ask price of $100.05 and the bid is $100.00, the stock needs to rise by more than 5 cents before you can sell it for a profit. That 5-cent gap is your first hurdle.
The bid-ask spread is more than just a cost; it’s a vital sign of the market's health and an asset's liquidity. A tight spread usually signals a healthy, active market, while a wide spread can be a red flag for low volume and higher risk.
This is why a deep understanding of the spread is non-negotiable for managing your trading costs and finding profitable entries. It's a core principle we've integrated into our automated day trading software, which is designed to help traders pinpoint opportunities where this cost is as low as possible.
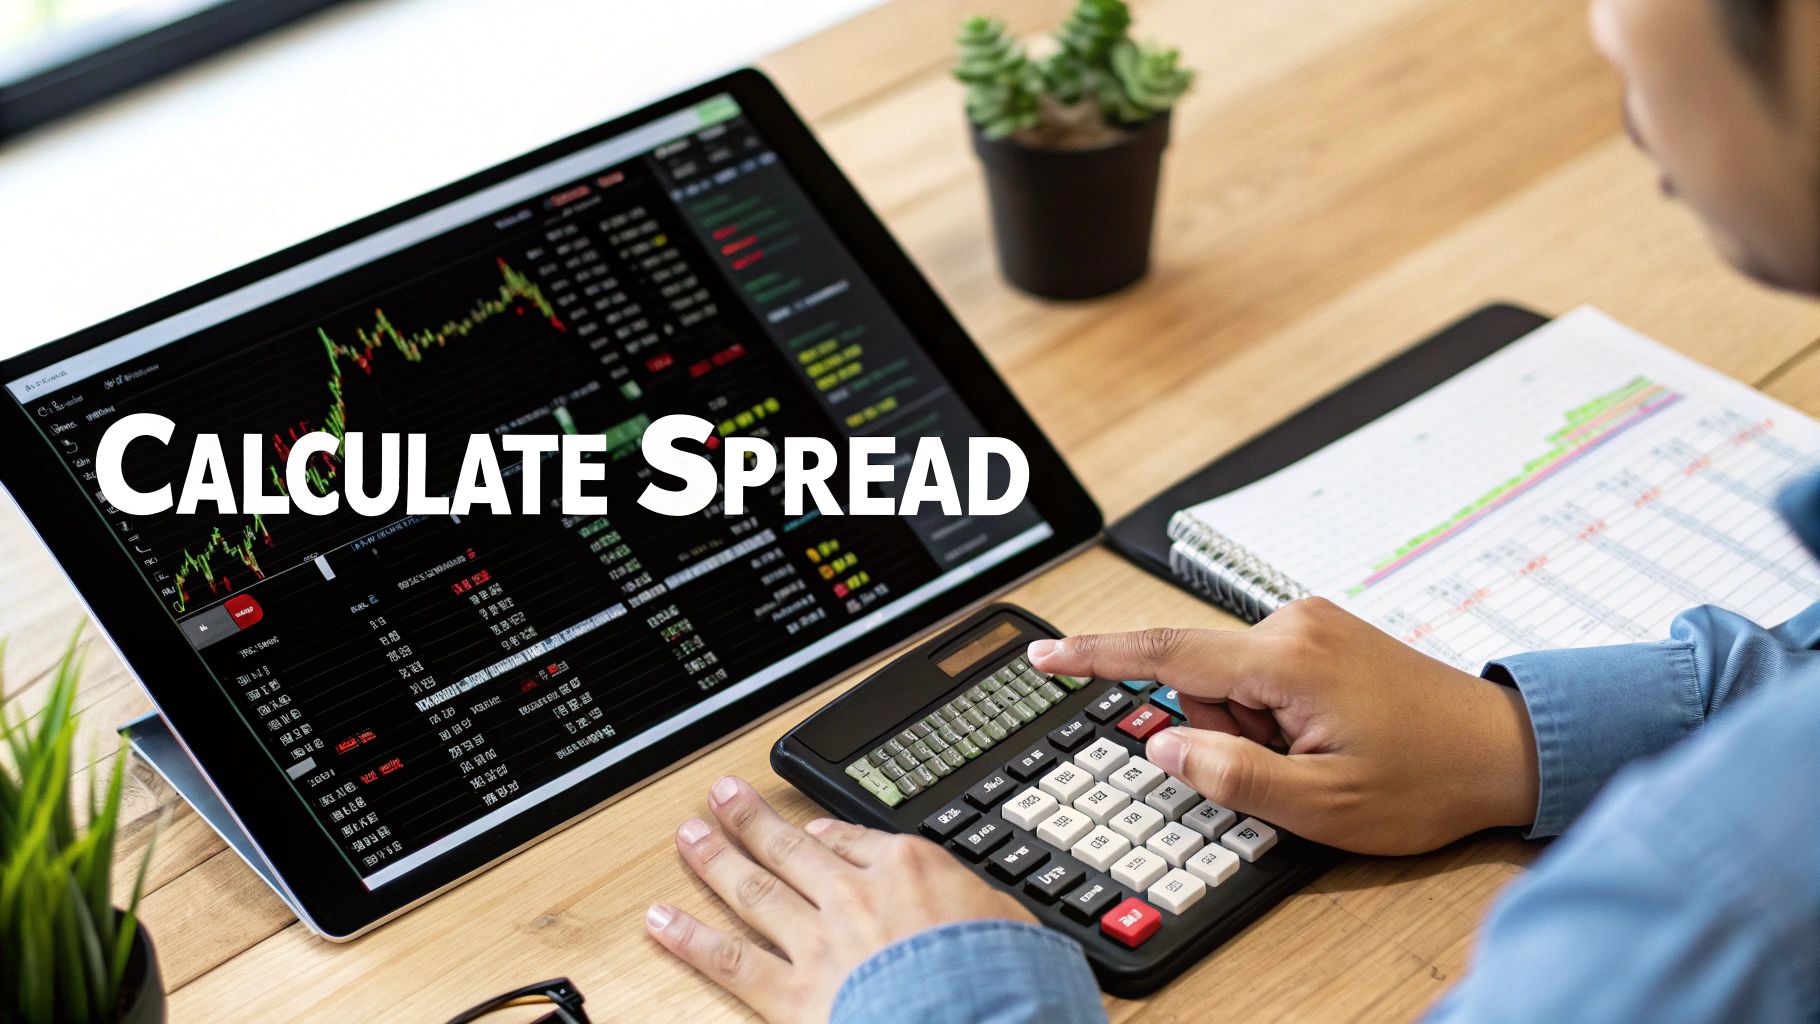
Calculating the Spread in Real-World Trading
It's one thing to understand the theory, but seeing how the bid-ask spread works in practice is where it really clicks. Thankfully, figuring out the spread is pretty simple and gives you an instant snapshot of a trade's built-in cost.
The basic math is as straightforward as it gets:
Ask Price – Bid Price = Bid-Ask Spread
Let's say you're looking to trade a stock and see these prices on your screen:
- Bid:$50.25 (The highest price someone is willing to pay, so it's the price you can sell at right now.)
- Ask:$50.30 (The lowest price someone is willing to sell for, so it's the price you have to pay to buy right now.)
Just plug those numbers in: $50.30 – $50.25 = $0.05. That five-cent difference is the raw spread. But a raw number like $0.05 doesn't tell the whole story. A five-cent spread on a $10 stock is a much bigger deal than a five-cent spread on a $500 stock.
Putting the Spread into Perspective: The Percentage
To really compare apples to apples across different assets, you need to turn that spread into a percentage. This gives you a standardized way to measure the cost and see just how "expensive" one trade is compared to another.
Here’s the formula to get that percentage:
(Ask Price – Bid Price) / Ask Price * 100 = Spread Percentage
Using our same example, the calculation looks like this: ($0.05 / $50.30) * 100 = 0.099%. Now that is a useful number. This percentage is a key metric for gauging your trading costs and overall efficiency.
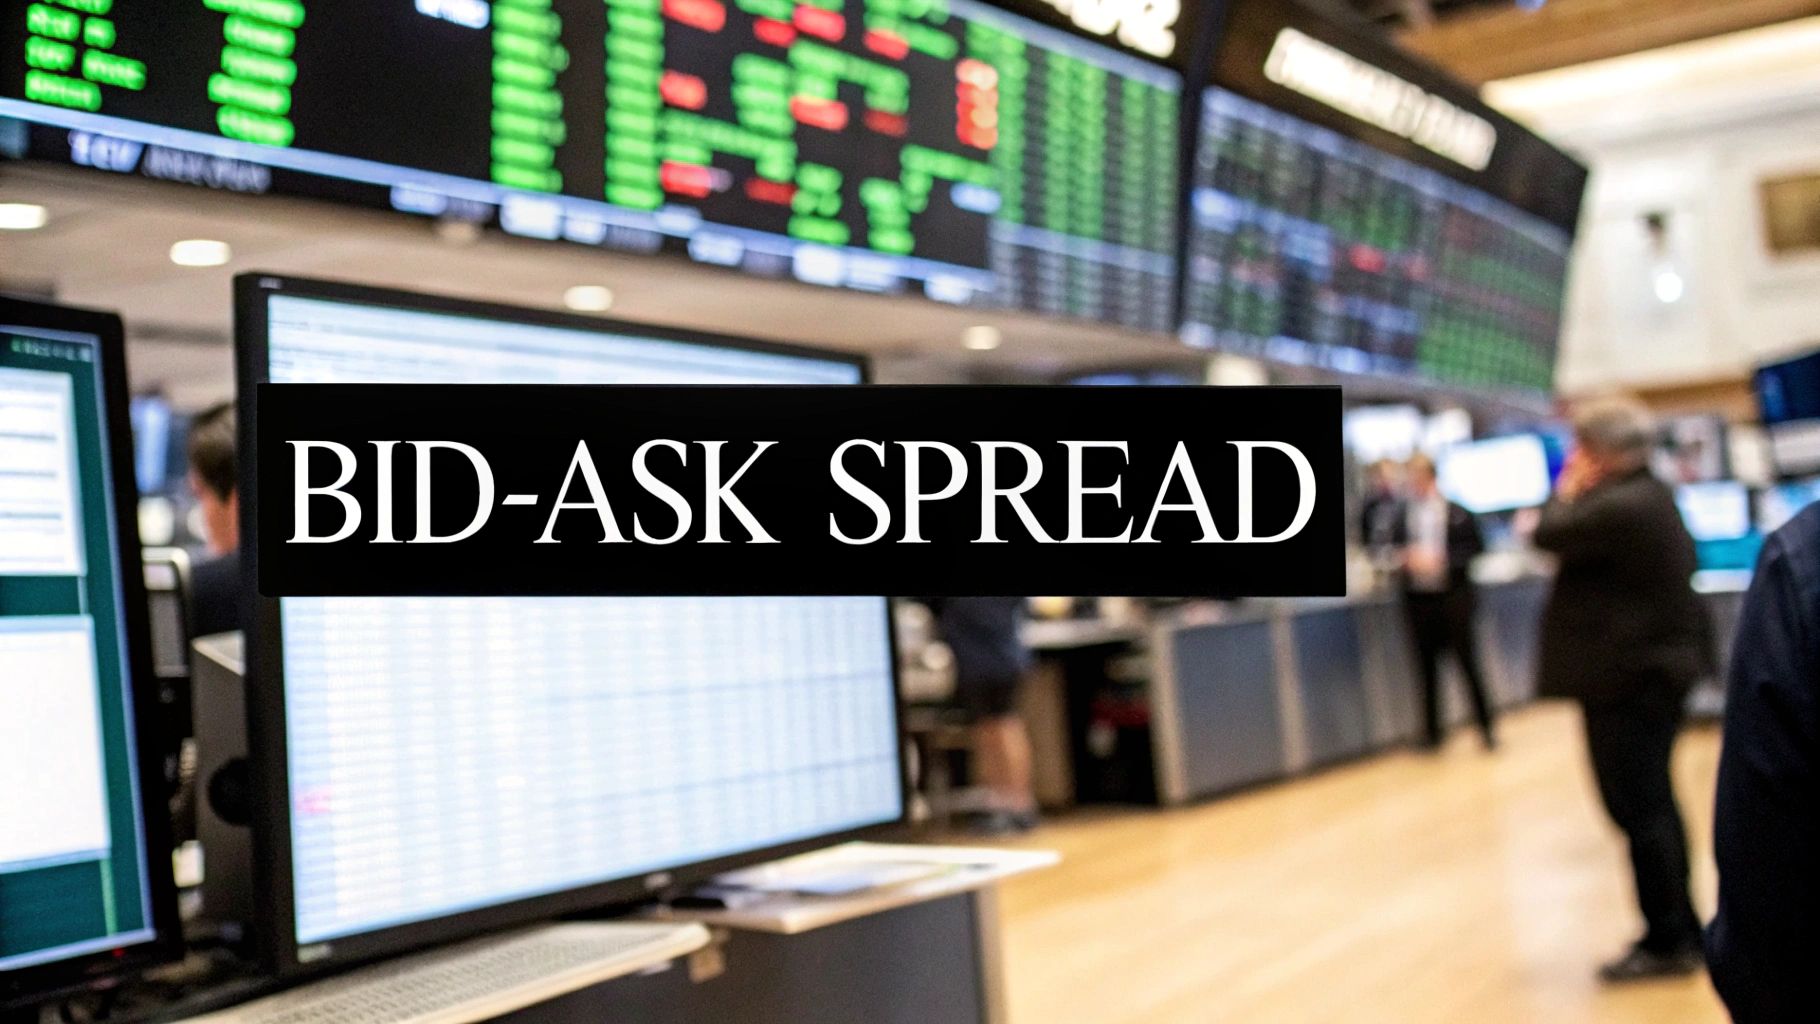
You can see this in action on just about any trading platform. The screenshot below shows how the bid, ask, and the resulting spread are typically displayed for a stock.
The image perfectly illustrates the live bid and ask quotes, with the spread being that immediate gap you have to cross to enter and exit a position. Of course, crunching these numbers manually for every potential trade would be a massive headache. That's why automated tools are so valuable—they can do this work instantly, helping traders spot the most cost-effective opportunities in real-time.
Why the Spread Is a Critical Market Indicator
Think of the bid-ask spread as more than just a transaction cost. It’s a real-time report card on a market's health, and more specifically, its liquidity. Learning to read this signal is a fundamental skill for any trader who wants to get ahead.
A tight, or narrow, spread is a great sign. It tells you the market is buzzing with activity. Lots of buyers and sellers are competing, which naturally pushes the bid and ask prices closer together. For you, this means it’s cheaper and easier to jump in and out of a trade.
On the other hand, a wide spread is a red flag. It points to lower liquidity, which often comes with higher risk and steeper trading costs. You’ll typically see this with less-traded assets or when the market gets shaky and big players widen their spreads to play it safe.
How the Spread Can Make or Break a Trade
For anyone trading frequently, especially those using short-term strategies like scalping, the size of the spread can be the difference between a winning day and a losing one. Scalpers hunt for tiny, quick profits, and a wide spread can gobble up that profit before the trade even has a chance.
This is exactly why spotting these conditions is so important. Recognizing a low-liquidity environment can save you from getting into a bad trade from the start. This principle applies across the board, and you can see how it plays out in different scenarios by reading about future markets in our detailed guide.
But here’s a pro tip: the spread you see isn't always the full story. Research on S&P 500 stocks has found that the standard way of calculating spreads can inflate the actual cost of trading, with an average bias of around 18%. This just goes to show how vital precise analysis is for managing your money effectively.
A wide spread is a warning. It’s often a sign that an asset isn’t traded much or that market volatility is spiking, making it a riskier and more expensive proposition.
By learning to interpret the bid-ask spread, you gain an instant snapshot of market sentiment and liquidity. It’s a simple yet powerful tool for making smarter decisions, keeping risk in check, and ultimately, improving your trading results.
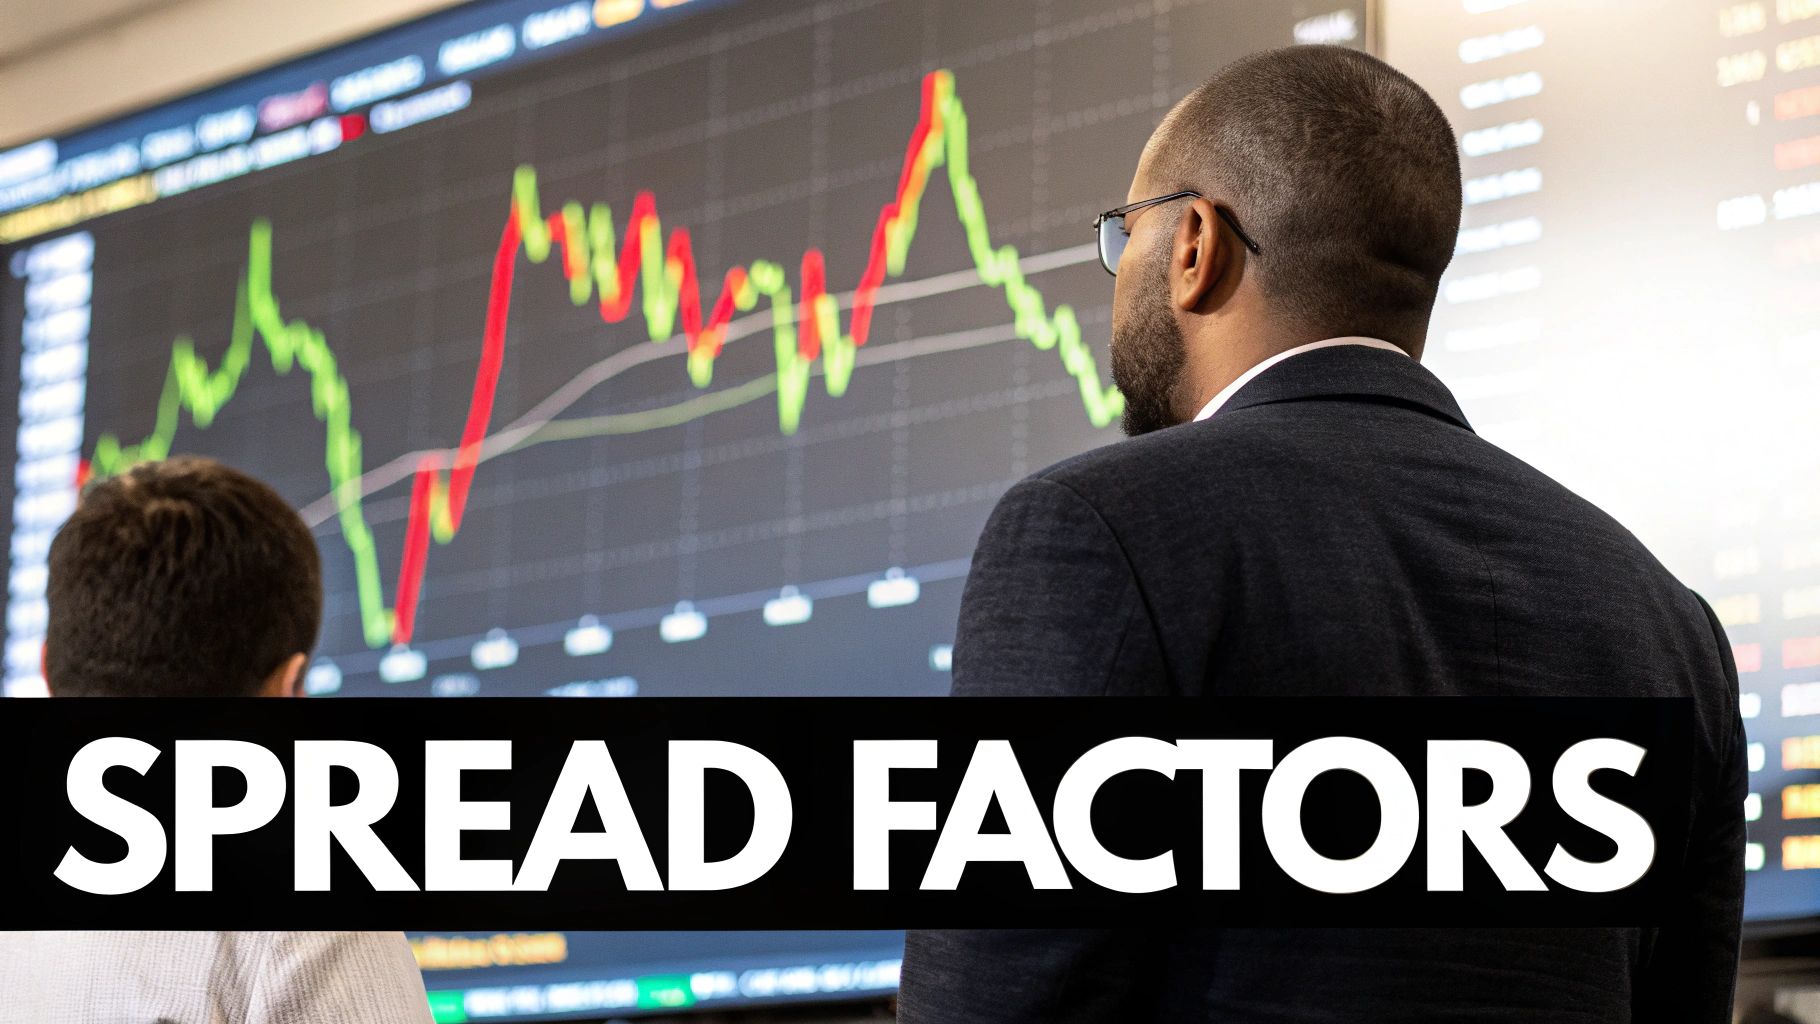
What Drives the Size of the Bid-Ask Spread?
The gap between the bid and ask prices isn't a fixed number. It's a living, breathing thing that expands and shrinks based on a few core market dynamics. If you can get a feel for what makes the spread change, you'll be much better at timing your trades and managing your costs.
So, what are these forces? It really boils down to three main things.
As you can see, the spread is simply the space between what buyers are willing to pay and what sellers are willing to accept. Let's dig into what makes that space wider or narrower.
Liquidity and Trading Volume
Hands down, the single biggest factor affecting the spread is liquidity. Think of it as the amount of buying and selling interest in a particular asset at any given moment.
- High Liquidity: When an asset is popular—like Apple (AAPL) stock or the EUR/USD currency pair—it attracts a huge crowd of traders. This high volume creates fierce competition among market makers, who have to keep their spreads tight to attract orders.
- Low Liquidity: On the other hand, a little-known penny stock or an obscure crypto token might have very few active participants. With less competition, market makers can get away with offering much wider spreads.
Market Volatility
Volatility is a measure of how wildly an asset's price is bouncing around. When the market gets choppy, spreads react almost immediately.
Picture a major economic announcement or a surprise news event. Uncertainty spikes, and market makers widen their spreads to shield themselves from the risk of getting caught on the wrong side of a sudden price move. This is why you'll often find that trading is most expensive right when the action is hottest.
The Asset Itself
Finally, the inherent nature of the asset is a huge piece of the puzzle. A stable, blue-chip company will almost always have a tighter spread than a speculative small-cap stock you’ve never heard of. It’s all about the built-in risk and typical trading volume associated with that specific asset.
This isn't just theory; long-term studies of the U.S. stock market back it up. Research has shown that large, frequently traded stocks can have spreads well below 0.5%. In contrast, smaller, less-traded stocks can see spreads that are several times higher, showing a direct link between market conditions and your trading costs. For a deeper dive, you can explore this in-depth paper on how stock characteristics influence spreads.
How Spreads Behave in Different Market Cycles
The bid-ask spread isn't just some static trading fee. Think of it more like a real-time barometer for the market's mood, expanding and contracting with the cycles of fear and confidence. If you learn to read it, you gain a powerful edge in spotting risk and opportunity.
When full-blown panic grips the market, like during the 2008 financial crisis, fear is the only thing on traders' minds. As the floor of certainty falls out, liquidity dries up almost instantly. To protect themselves from the chaos, market makers are forced to dramatically widen the gap between their bid and ask prices. This turns the market into a high-cost, high-risk minefield.
But in a long-running bull market, the opposite is true. Calm confidence reigns, trading volume is strong, and liquidity is plentiful. The intense competition between market makers squeezes spreads until they're razor-thin. It’s in these moments that getting in and out of trades becomes incredibly cheap and efficient.
A Look at Historical Spreads
History paints a vivid picture of this relationship. Data from the New York Stock Exchange, for example, shows just how sensitive spreads are to major economic shocks. During the extreme market stress of the Great Depression, average monthly spreads shot past 10% in 1932 and 1933—a clear sign of rock-bottom liquidity and crippling uncertainty.
Fast forward to the period of relative calm from the early 1950s to the early 1970s. Spreads stayed consistently low, reflecting a much healthier and more efficient market. You can dig into a detailed analysis of these historical market liquidity changes to see the raw numbers yourself.
Viewing the bid-ask spread through this historical lens shows it's not a static number but a dynamic reflection of collective market psychology.
This insight is invaluable. It helps you put today's market conditions into context and tailor your trading approach. Knowing whether you’re operating in a high-spread (fearful) or low-spread (confident) environment is a cornerstone of smart risk management. To put this knowledge into action, our guide on simple day trading strategies provides practical methods for navigating different market cycles.
Trading Smarter by Navigating the Spread
Now that you have a solid grasp of what drives the bid-ask spread, it's time to put that knowledge to work. At Trading Made Easy, our automated day trading software is built to do just that. Our key features—from our patented AI that identifies market direction to our fully automated execution—are designed to take the emotion and guesswork out of navigating these market realities. By managing entries, exits, and risk for you, our software helps you focus on strategy, not stress.
Traders like John H. from Texas have shared how our system transformed his approach. "Before, I was constantly second-guessing my trades and getting eaten alive by costs," he said. "Now, the software handles the execution with a discipline I couldn't match, allowing me to finally see consistent results." This is the advantage of turning market knowledge into automated action.
Practical Strategies to Minimize Spread Costs
You can start putting these ideas into practice right away. The two simplest yet most powerful tactics come down to choosing what and when you trade, and how you enter the market.
Trade Liquid Assets at Peak Times: Stick to assets with tons of trading volume, and trade them when their specific market is most active. This is when liquidity is deepest, which naturally leads to the tightest possible spreads and lower costs for you.
Use Limit Orders: A market order basically says, "I'll pay whatever the going rate is." A limit order, on the other hand, lets you name your price. By setting the maximum price you’re willing to pay, you protect yourself from paying a wider spread if the market suddenly moves against you.
Once you truly understand how spreads operate, you stop being a passive participant and start trading with a clear advantage. We actually designed our automated day trading software to execute based on these very principles, removing the emotion and guesswork. To see more ways to apply these concepts, check out our guide to day trading strategies for beginners.
By mastering the bid-ask spread, you transform a hidden cost into a strategic advantage. It’s the difference between simply placing trades and executing a well-defined, cost-effective trading plan.
Feel free to explore what Trading Made Easy has to offer and see how our tools can help you apply these principles automatically. It’s a great first step toward building your own success story.
Answering Your Questions About the Bid-Ask Spread
Let's dig into some of the most common questions that come up when traders first start getting a handle on the bid-ask spread. Getting these concepts down solidifies your understanding and helps you see how they play out in the real world.
Who Actually Gets the Money from the Bid-Ask Spread?
That small difference between the bid and ask price goes directly to the market makers. Think of them as the wholesalers of the financial markets. They are usually large banks, brokerage houses, or specialized trading firms that provide liquidity by always being willing to buy and sell a particular asset.
They are rewarded for this service—and for the risk they take by holding onto assets that might drop in value—by capturing the spread. It’s their business model, and it's what keeps the market fluid so you can trade whenever you want.
Can the Bid-Ask Spread Ever Be Zero?
For all practical purposes, no. A spread of zero would mean market makers have no incentive to do their job. If there’s no profit in it, they’d simply stop offering to buy and sell, and market liquidity would dry up in an instant.
Of course, for assets with massive trading volume—like the EUR/USD currency pair or major government bonds—the spread can get razor-thin. We're talking fractions of a penny, or what forex traders call a 'pip'. But even then, a tiny, non-zero gap will almost always be there.
A zero spread is really just a theoretical idea, not something you'll find in any live trading environment.
What Is the Best Way to Reduce Spread Costs on My Trades?
This is where you can be proactive. You can't eliminate the spread, but you can definitely take smart steps to minimize its bite. It really boils down to being strategic about what you trade, when you trade it, and how you place your orders.
Here are a few of the most effective ways to keep your spread costs down:
- Trade During Peak Hours: The best time to trade any asset is when its home market is most active (e.g., U.S. stocks during New York trading hours). More traders mean more competition among market makers, which naturally squeezes spreads tighter.
- Stick to Liquid Assets: High-volume stocks, ETFs, and currencies are popular for a reason. Their deep liquidity means spreads are usually much tighter compared to obscure, thinly-traded assets.
- Use Limit Orders: A market order is a blank check—you're telling your broker to buy or sell at the best available price, no matter what. A limit order, on the other hand, lets you name your price. This puts you in control and protects you from paying a wide spread if the market suddenly gets choppy.
Getting a feel for these tactics is a huge step in becoming a more deliberate and cost-conscious trader. It’s one of those fundamental costs of doing business that you can learn to manage, not just accept.
Understanding the bid-ask spread is crucial, but it's just one piece of the puzzle. The true key to success lies in consistent, disciplined execution—something our automated software is designed to provide. By handling the complexities of the market for you, it frees you to focus on your larger financial goals. We've helped countless traders find a more confident and less stressful path in the markets. We invite you to see how we can do the same for you. Discover how Trading Made Easy can help you trade with greater confidence and efficiency.
Leave a Reply