
Figuring out market trends comes down to blending classic strategies with modern technology. Since 2014, Trading Made Easy has been on a mission to simplify the trading industry, making it accessible for everyone. We believe that by providing powerful, easy-to-use tools, we can help traders cut through the noise and navigate the markets with confidence.
Why We've Been Mastering Trends Since 2014
Back in 2014, when we started Trading Made Easy, we had one simple goal: make the world of trading something anyone could understand and access. The financial markets can feel like a maze of confusing jargon and scary-looking charts, enough to put off even the most motivated person. We get it because we've been there ourselves. Our whole mission was born out of a need to cut through that noise and create a clearer path to confident trading.
This guide isn't just a list of steps. It's a reflection of nearly a decade spent in the trenches. It’s packed with the lessons we've learned, the strategies we've polished, and the insights we've gathered from helping thousands of traders find their way through market swings. Our focus has always been on how to identify market trends by mixing old-school wisdom with powerful, easy-to-use technology.
Our Approach to Simplified Trading
Our philosophy is pretty straightforward: you shouldn't need a Ph.D. in economics or spend all day staring at complex data to be a successful trader. What you do need are the right tools and a clear plan. The strategies we're about to show you are the very same ones that power our automated day trading software.
We believe in giving traders a real edge by focusing on:
- Clarity: We break down complicated ideas into simple, actionable steps you can use right away.
- Efficiency: Our tools automate the heavy lifting of market analysis, so you can focus on making smart decisions.
- Consistency: We help you take the emotional guesswork out of trading, which is often what leads to costly mistakes.
Our journey has taught us that mastering trends isn't about being right 100% of the time. It's about building a solid system that consistently puts the odds in your favor. This idea is the foundation of every tool we build and every piece of advice we give.
This commitment goes beyond just our software. We've seen firsthand how a good community and ongoing education can completely change a trader's path. By combining solid education with our advanced trading tools, we’ve created a complete ecosystem designed to help you grow. Every chart pattern, indicator, and trend-spotting trick we talk about is built right into the logic of our platform, making it a smooth transition from learning to actually doing.
The goal is simple: to help you see the market not as a source of stress, but as a field of opportunity.
Reading The Big Picture With Fundamental Analysis
Before you ever pull up a single chart, you need to get a feel for the powerful economic forces that move entire markets. This is the world of fundamental analysis—it's all about connecting big-picture economic news to what you see happening in the long term. Think of it like checking the weather forecast before you plan a trip; it gives you the context you need to make smarter moves.
While technical analysis is laser-focused on price charts and patterns, fundamental analysis digs deeper. It helps you answer the most important question: "Why is the market moving this way?" When you learn to read economic news not as scary headlines but as clues, you can start to anticipate where the market might be headed next.
Key Economic Indicators To Watch
Certain economic reports can shift market sentiment in a heartbeat. These indicators are basically a health report for an economy, and traders and big institutions all over the world watch them like a hawk. Getting familiar with them is a must if you want to get good at identifying market trends.
Here are a few of the heaviest hitters:
- Gross Domestic Product (GDP): This is the ultimate report card. It measures the total value of everything an economy produces. When GDP is rising, it usually signals a bull market, where prices are climbing. When it’s shrinking, that can point to a recession and kick off a bear market.
- Inflation (CPI & PPI): The Consumer Price Index (CPI) and Producer Price Index (PPI) are your go-to reports for inflation. High inflation eats away at people's spending power and often forces central banks to hike interest rates, which can really cool down the market.
- Employment Data: Reports like the Non-Farm Payrolls (NFP) in the U.S. tell you how many jobs were created or lost. Strong job numbers are a great sign, but rising unemployment can be an early red flag for economic trouble ahead.
- Central Bank Policies: Always keep an eye on what central banks like the Federal Reserve are saying. Their decisions on interest rates and money policy are some of the most powerful drivers of market direction, period.
Once you get a handle on these indicators, you stop being a reactive trader who’s constantly surprised by market swings. You become a proactive one who actually understands the forces causing them. That perspective is priceless for long-term success.
Connecting Economic Data To Market Trends
The real magic of fundamental analysis is connecting the dots between these numbers and what’s actually happening in the markets. Historically, you can see that major market trends are almost always tied to economic performance. Just look at the relationship between GDP growth and the stock market in the U.S.
The economic history of the United States shows this perfectly. If you look at U.S. GDP data from 1929 to 2022, you can see clear patterns that line up with market cycles. During the Great Depression, which started in 1929, the GDP nosedived—right along with the stock market in a historic crash. On the flip side, the economic boom after World War II sent GDP soaring and fueled a massive, long-running bull market.
Looking at this historical data, you can see the GDP climb from about $1 trillion in the early 1950s to over $23 trillion by 2022. This kind of context helps you realize that market trends aren't just random noise; they're a reflection of what's happening in the broader economy. This is why you can't have a solid trading strategy without a good grasp of the fundamentals.
Practical Application For Traders
So, what does this all mean for your actual trading? You don't need a PhD in economics, but you do need a system.
Start by keeping an economic calendar open. Know when the big reports like GDP or CPI are coming out. When the numbers drop, watch how the market reacts. Does it move as expected, or was there a surprise?
For example, if inflation comes in way hotter than anyone predicted, you can bet the central bank might start talking tough on interest rates. That could put downward pressure on stocks. This insight lets you adjust your positions or, at the very least, manage your risk better.
It also helps you decide when to jump into a trade and what kind of order to use. That's a critical skill on its own, and you can learn more by checking out our guide on the differences between a market order vs a limit order to make sure you're executing your strategy effectively.
At the end of the day, fundamental analysis gives you the "why" behind what the market is doing. It's the solid foundation you build your technical, chart-based strategies on top of.
Alright, you've got the big-picture view from fundamental analysis. Now it's time to roll up your sleeves and get into the charts. This is where technical analysis really shines, handing you the tools to turn all that market data into trades you can actually execute.
Think of technical indicators as your guide for cutting through the market noise. They aren't a crystal ball, but they are incredibly good at revealing the underlying patterns and momentum that drive price. Once you get the hang of a few key indicators, you'll find yourself spotting trend strength—and potential reversals—with much more confidence.
The whole process is pretty straightforward when you break it down.
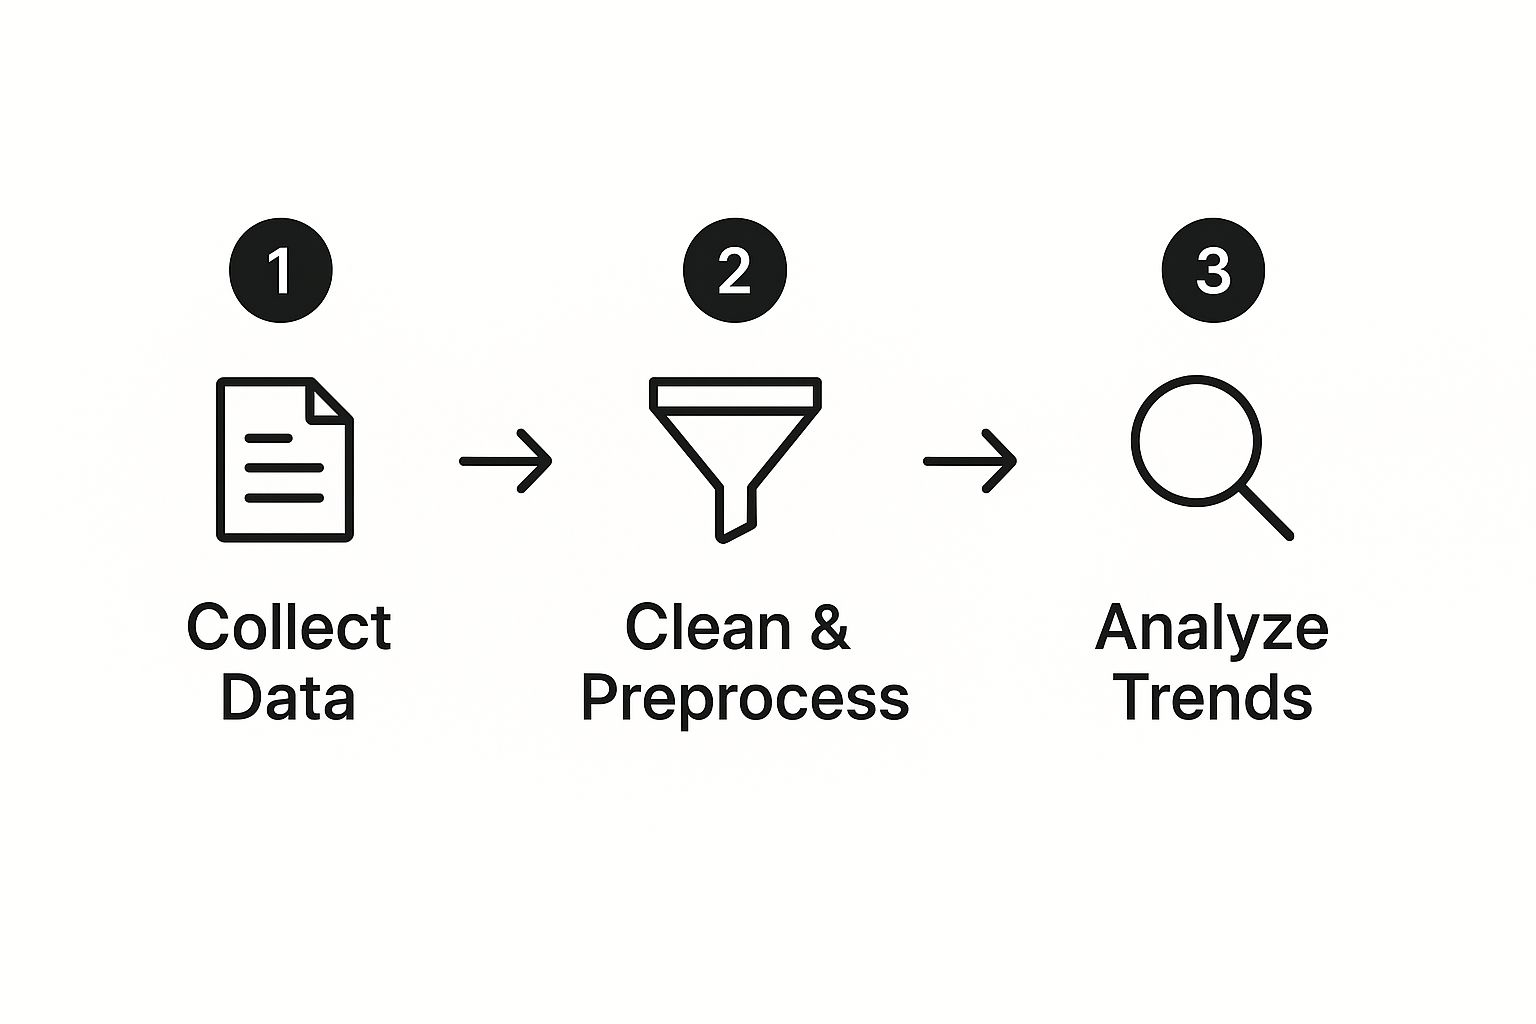
You start with the raw data, clean it up, and then use your indicators to find the real trend. That's the heart of it.
Getting Started with Moving Averages
Moving averages (MAs) are the bedrock of trend identification. They smooth out the chaotic day-to-day price swings, giving you a clearer view of the market's true direction. The two you'll run into most often are the Simple Moving Average (SMA) and the Exponential Moving Average (EMA).
- Simple Moving Average (SMA): This is just the average price over a set period. A 50-day SMA, for example, is the average closing price of the last 50 days. It's fantastic for confirming those long, steady trends.
- Exponential Moving Average (EMA): The EMA puts more emphasis on recent price action. This makes it a bit more responsive and quicker to signal when a trend might be shifting gears.
The rule of thumb is simple: when the price stays consistently above a key moving average (like the 50-day or 200-day), you're likely in an uptrend. If it's trading below, you're probably looking at a downtrend.
Checking Momentum with the RSI
Next up is the Relative Strength Index (RSI), a momentum indicator that tells you how fast and how far prices are moving. It oscillates between 0 and 100, flagging when an asset might be overbought (usually over 70) or oversold (below 30).
But for trend trading, its real value is in confirming momentum. In a healthy uptrend, you'll often see the RSI hang out above the 50 line, even pushing into overbought territory. In a solid downtrend, it will tend to stay below 50.
A common rookie mistake is seeing an RSI above 70 and immediately hitting the sell button. In a strong, trending market, an asset can stay "overbought" for a long, long time. It’s often a sign of strength, not a guaranteed reversal.
Finding Confidence Through Confluence
The real secret sauce of technical analysis isn't relying on a single indicator. It's about getting multiple signals to agree. We call this confluence, and it’s what gives experienced traders the conviction to pull the trigger.
Imagine a stock’s price pops above its 50-day EMA—that’s a classic bullish signal. But you don't stop there. You glance at the RSI. Is it also climbing above 50? If so, you've just confirmed the upward move has real momentum behind it. That one-two punch is far more reliable than either signal on its own.
Another powerful combo is using the Moving Average Convergence Divergence (MACD) with a long-term moving average. The MACD is built specifically to show changes in a trend's strength and direction. A bullish MACD crossover that happens while the price is already above the 200-day SMA? That's a high-conviction signal that a new uptrend is for real.
To help you get a handle on the most popular indicators, here’s a quick-reference table.
Key Technical Indicators for Trend Identification
This table breaks down some of the most effective technical indicators, what they do, and the kind of signals you should be looking for.
| Indicator | Primary Function | Bullish Signal Example | Bearish Signal Example |
|---|---|---|---|
| Moving Averages (MA) | Smooths price data to identify trend direction. | Price crosses and stays above the 50-day or 200-day MA. | Price crosses and stays below the 50-day or 200-day MA. |
| Relative Strength Index (RSI) | Measures momentum and overbought/oversold conditions. | RSI consistently stays above 50, showing strong upward momentum. | RSI consistently stays below 50, indicating strong downward momentum. |
| MACD | Shows the relationship between two moving averages of a security’s price. | The MACD line crosses above the signal line, especially above the zero line. | The MACD line crosses below the signal line, especially below the zero line. |
| Volume | Confirms the strength or weakness of a price move. | Price increases on high or rising volume. | Price decreases on high or rising volume. |
Think of this as your starting toolkit. As you gain experience, you'll learn how each one behaves in different market conditions and how to combine them for the strongest signals.
Don't Forget About Volume
Finally, never, ever ignore volume. It's the fuel behind every market move. A trend identified by your indicators needs to be backed by strong volume to be trustworthy.
Historical data shows that daily traded shares can easily range from hundreds of millions to billions. When you see a price rising on increasing volume, it tells you that buyers are engaged and confident. But if the price is drifting up on weak, declining volume? That's a major red flag—the trend might be running out of gas.
As an example, data from exchanges like Cboe shows that major trend shifts in big indices like the Dow Jones Industrial Average are almost always accompanied by significant spikes in trading volume. It's the market's way of confirming that something has truly changed.
Gain an Edge with Automated Trend Analysis
So, you’ve learned how to read the economic big picture and use technical indicators to find your signals. But spotting a trend is only half the battle. The real challenge is acting on those trends with speed and consistency. This is where our automated day trading software shines, giving traders a critical edge. Its unique features are designed to turn your strategy into flawless execution.
Here's how our software benefits traders:
- Emotion-Free Execution: It removes the fear and greed that lead to costly mistakes. The software executes your strategy based on pure data and logic, ensuring disciplined trading every time.
- Lightning-Fast Speed: In fast-moving markets, every second counts. Our system can execute trades up to 1,000 times faster than manual clicking, helping you secure better entry and exit prices.
- 24/7 Market Scanning: You can't watch every chart at once, but our software can. It tirelessly scans the market for your exact criteria, so you never miss an opportunity, even when you're away from the screen.
- Advanced Confluence Analysis: It can simultaneously track multiple indicators across various assets, only triggering a trade when all your conditions for a high-probability setup are met.
Imagine trying to catch a perfect confluence of signals—say, a moving average crossover, an RSI confirmation, and a volume spike—across five different assets simultaneously. For a human, that's practically impossible. Our software does it in a flash, scanning the entire market for your exact criteria without ever getting tired or distracted.
How Automation Sharpens Your Trend Trading
At its heart, automation is all about using technology to execute a solid plan flawlessly. Since we launched back in 2014, our mission at Trading Made Easy has been to give every trader access to this kind of power. We developed our patented, AI-driven platform to handle all the heavy lifting of trend analysis and trade execution.
This frees you up to focus on what really matters: your strategy. Here’s a look at how our key features directly help you find and act on market trends:
- Algorithmic Pattern Recognition: The software uses sophisticated algorithms to pinpoint the exact trend patterns you’re looking for, like breakouts or pullbacks, based on the technical rules you set. It never gets creative or deviates from your plan.
- Simultaneous Multi-Indicator Analysis: It can watch dozens of indicator combinations across the market in real-time. This means that when a genuine opportunity pops up, you know it meets all your conditions for a high-probability trade.
- Emotion-Free Execution: This might be the single biggest advantage. The software executes every trade based purely on data and logic. It completely removes the emotional gut-reactions that cause traders to hesitate on an entry or cut a winning trade loose too soon.
By automating your strategy, you transform trend trading from a stressful, reactive activity into a systematic, disciplined process. You are no longer just a participant in a market; you are the architect of a system designed to navigate it.
Capitalizing on Speed and Precision
In the world of day trading, especially in fast-moving futures markets, speed is everything. A profitable setup can appear and vanish in the blink of an eye. Our automated system can execute a trade up to 1,000 times faster than a person can click a mouse. That speed is crucial for getting the best possible entry price, which can make a huge difference to your bottom line.
Precision is just as critical. The software enters and exits trades at the exact price points you define in your strategy, including your pre-set stop-losses and profit targets. This mechanical consistency is the bedrock of good risk management and a key part of many successful day trading strategies for beginners and veterans alike.
A Practical Scenario Where Automation Shines
Let's walk through a real-world example. A trader wants to go long on an asset, but only when the 20-period EMA crosses above the 50-period EMA, the RSI is above 60, and the trading volume is 25% higher than its average.
If you were doing this manually, you'd have to stare at the chart, waiting for all three conditions to line up perfectly. It's easy to get distracted, look away for a second and miss the signal, or just hesitate when the moment finally arrives.
With the Trading Made Easy software, you just program those rules into the system. It then watches the market for you, 24/7. The instant all three of your criteria are met, it executes the trade. No hesitation. This is how you capitalize on those fleeting opportunities that manual traders often miss, giving you a real, tangible edge.
Real Stories from Our Trading Community
Theory and charts are one thing, but seeing how our software helps real people succeed is what truly matters. Since 2014, we’ve seen countless traders transform their results by leveraging automation to overcome common hurdles. These success stories highlight the power of combining a solid strategy with the right technology.
Conquering Emotional Trading for Good
One of our members, a part-time trader, was stuck in a classic cycle. He knew how to spot trends but consistently let emotions dictate his actions. He would close winning trades too early out of fear, only to hold onto losing trades for too long, hoping for a turnaround. This is a common struggle that our software is built to solve.
By programming his trusted trend-following strategy into our automated system—including his exact rules for entries, stop-losses, and profit targets—he removed himself from the decision-making hot seat. The software executed his plan flawlessly.
"The biggest change was psychological. I trust the system because it’s just executing my own plan, but without the panic or greed. My consistency has skyrocketed because the emotional rollercoaster is gone."
This is the perfect illustration of what automation should do. It’s not about replacing the trader; it’s about empowering them to execute their strategy with perfect discipline.
Spotting a Major Shift Others Missed
Another success story came from an experienced trader who found it impossible to monitor all the markets she was interested in. One afternoon, while she was focused on a different chart, our software, running her strategy in the background, detected a critical shift in a futures market she wasn't even watching.
The system identified a convergence of signals—a key moving average break combined with a sudden volume spike—that pointed to a major trend reversal. It executed the trade based on her rules, getting her in at the very start of a massive downward move she would have otherwise missed. This demonstrates how our platform acts as an ever-vigilant partner, sifting through mountains of data to find high-probability setups. For a closer look, you can explore the economic analytics available through services like S&P Global Market Intelligence.
These examples show that whether you're battling emotions or just need more bandwidth, our software provides the tools to trade smarter.
Your Journey to Smarter Trading Starts Now
We've covered the core principles of how to identify market trends, from high-level fundamental analysis to the specifics of technical indicators. You've also seen how our automated software can be the bridge between knowing your strategy and executing it with precision and discipline. The key takeaway is that successful trading is a skill built on a solid foundation of knowledge, strategy, and the right tools.
Taking the Next Step in Your Evolution
Since we founded Trading Made Easy in 2014, our mission has been to close the gap between theory and practice. Our automated day trading software is designed to be your partner, handling the heavy lifting of analysis and execution so you can focus on strategy.
By using our system, you can:
- Eliminate Emotional Errors: Trades are placed based on your rules, not on fear or greed.
- Leverage Advanced Analysis: The software can monitor multiple indicators and assets simultaneously, catching opportunities you might miss.
- Trade with Unmatched Speed: Execute orders up to 1,000 times faster than manual trading to secure the best prices.
These aren't just features; they are practical solutions that give you a consistent edge. The success stories from our members show that with the right tools, you can overcome common trading hurdles and achieve your goals.
Become Our Next Success Story
We encourage you to explore what Trading Made Easy can offer. Take the next step and see our system in action.
Watch a demo of our software to discover how it can streamline your process and help you trade with more confidence and skill. Your journey to smarter, more disciplined trading begins now.
Your Questions, Answered
As you start putting these trend-spotting techniques into practice, you're bound to have some questions. It’s only natural. Here are a few of the most common ones we get from traders, along with some straight answers from our experience.
How Long Does a Trend Need to Be Confirmed?
There's no magic number here. The answer really depends on your own trading horizon. A day trader might see a trend as confirmed after just a couple of hours of solid price action above the 9-period EMA. They need to move fast.
On the other hand, a swing trader looking at daily charts might wait for the price to close above the 50-day SMA for an entire week before they feel confident enough to act. It's a completely different game.
The real key is deciding what "confirmation" means for your strategy. It’s rarely just one thing. A new uptrend isn't just about the price crossing a line; you want to see that move backed by increasing volume and a strong RSI reading above 50.
A great rule of thumb I've always followed is the "three-touch" principle. If a new trendline gets tested and holds three separate times, it’s a much more reliable signal. It tells you that other traders see the same thing you do and are acting on it.
Can I Just Use One Indicator to Find Trends?
I'll be blunt: relying on a single indicator is one of the riskiest moves you can make. It might feel simpler, but it's a trap.
Every indicator has blind spots. The RSI is fantastic for gauging momentum, but it can scream "overbought" for weeks during a powerful, grinding uptrend, causing you to sell way too early. A moving average is great for direction, but it's always a step behind in fast-moving, volatile markets.
The real confidence comes from confluence—when several different, unrelated indicators all point to the same conclusion. Imagine this: the price breaks above its 50-day SMA, the MACD makes a bullish crossover, and you see a huge spike in volume. That’s a high-probability setup. This layered approach is your best filter against market noise and false signals.
How Does Automated Software Handle Unexpected News?
This is a fantastic and crucial question. No algorithm can predict a surprise announcement from the Fed or a sudden geopolitical flare-up. What a robust automated system can do is manage the chaos through disciplined, pre-planned risk management.
Our platform, for example, doesn't try to "understand" the news—it just follows your rules to the letter.
It will instantly honor your pre-set stop-loss orders. If a news event sends the market spiraling against your position, the software will exit the trade at your exact loss limit. No hesitation. No emotion. It protects your capital when you might be frozen by panic.
Even better, it won't jump back in until the market settles and conditions perfectly match your strategy's criteria again. It’s this combination of algorithmic speed and built-in discipline that acts as a steady hand during the most turbulent times.
Ready to stop guessing and start trading with a data-driven system? Trading Made Easy provides the tools and support you need to implement your strategies with speed and precision.
Explore our automated trading software and see how it works.
Leave a Reply