
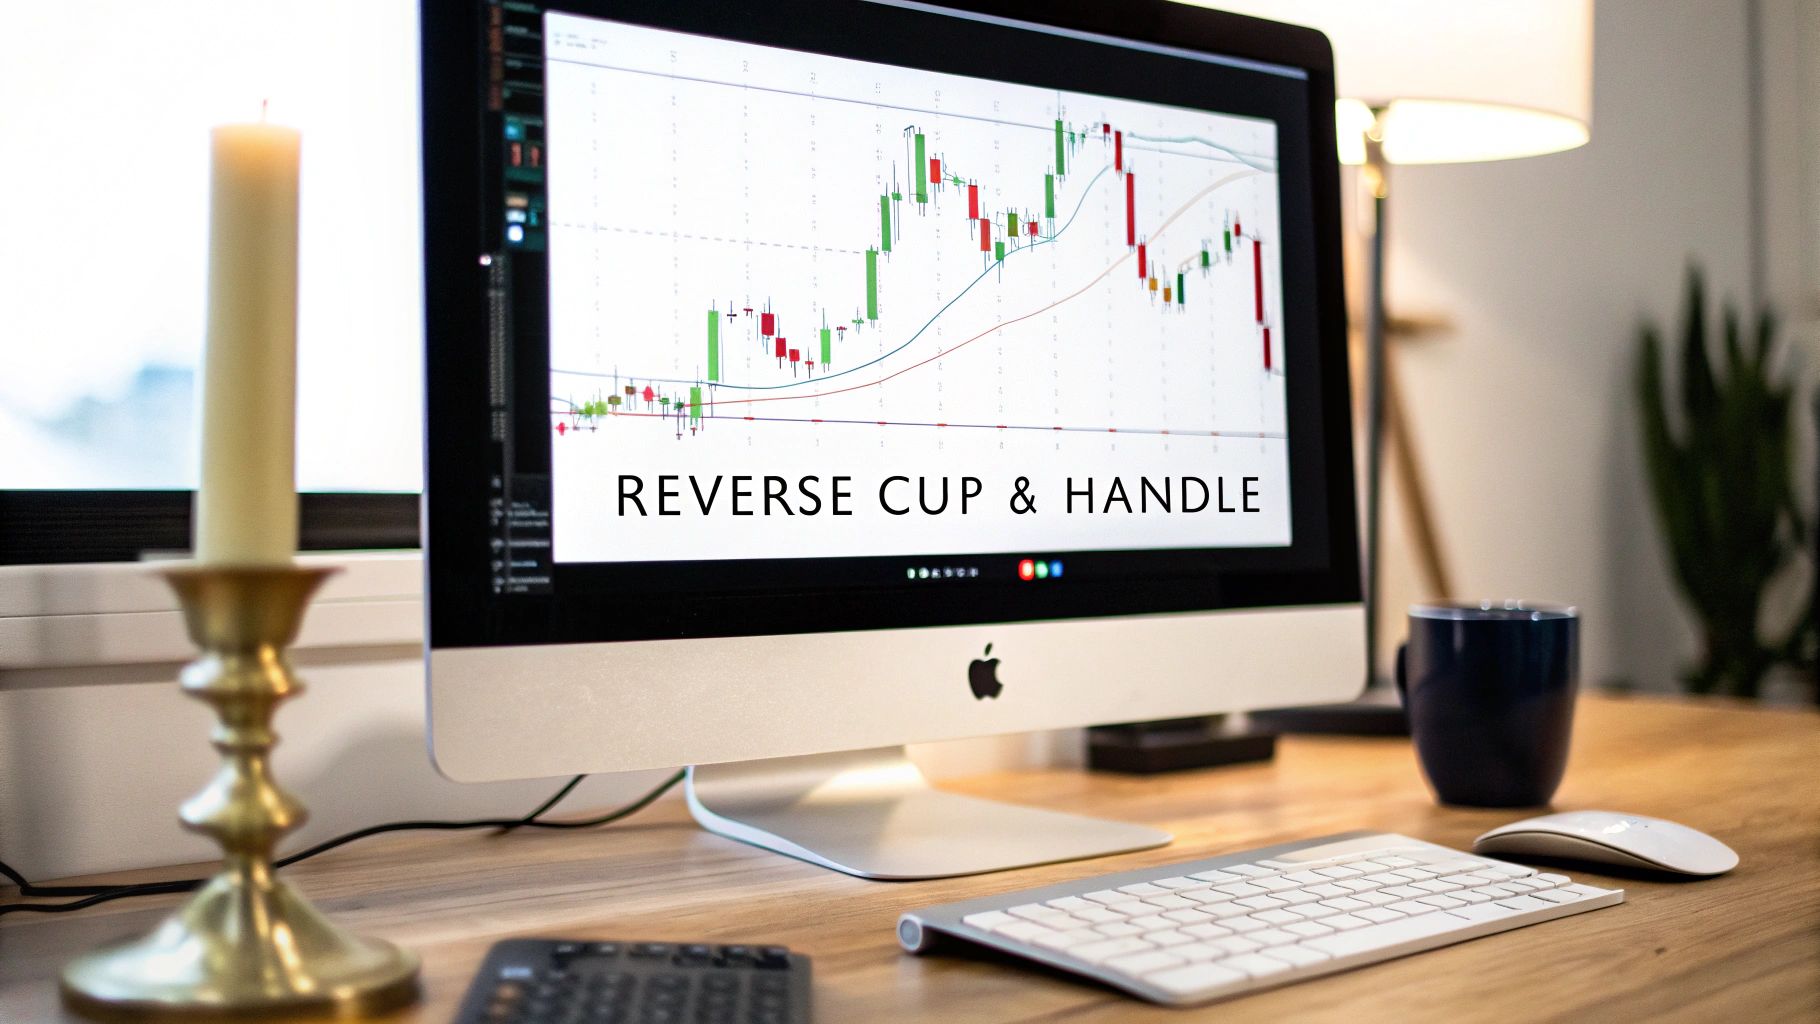
When you're scanning charts, some patterns jump out as clear warnings. The reverse cup and handle is one of them. It's a powerful bearish formation that often shows up right after an uptrend starts to run out of gas, telling you that sellers are about to take over.
Since 2014, Trading Made Easy has been on a mission to simplify the complexities of the trading world. We believe that with the right tools, any trader can execute their strategies with precision and confidence. This guide is part of that mission—to help you master powerful patterns like the reverse cup and handle.
Think of it as a clear signal that the buying frenzy is over and a significant drop could be on the horizon.
What Is the Reverse Cup and Handle Pattern

The reverse cup and handle is a technical pattern that gets its name from its very distinct shape: a big, rounded top that looks like an upside-down cup, followed by a slight upward drift in price, which forms the handle. For traders, correctly spotting this setup is a huge advantage for getting ahead of potential market declines.
I like to picture it like a roller coaster. The cars climb a big hill (the prior uptrend), slowly round the very top as they lose momentum (the cup), and then get one last, tiny lift (the handle) before plunging down the other side. That's essentially the story the reverse cup and handle tells about market momentum.
Key Takeaway: This isn't just a random shape on your screen. It visually captures a battle between buyers and sellers where the bears ultimately win. This creates a high-probability setup for anyone looking to go short.
The Anatomy of the Pattern
To trade this pattern effectively, you need to know its three essential parts. Each piece of the puzzle tells a part of the story about a failing uptrend. The structure is everything—a sloppy, poorly formed pattern is usually just noise and not a reliable signal.
A true reverse cup and handle will always have these components in order:
- The Inverted Cup: This starts with a rounded top that forms after a nice run-up in price. It's not a sharp, V-shaped peak; instead, it's a gradual rollover, showing that buying pressure is slowly drying up as sellers step in.
- The Handle: Once the cup is formed, the price stages a small, brief rally. This handle should look tiny compared to the cup and often drifts slightly upward. This is the last gasp from the buyers, a final, weak attempt to push the price higher that ultimately fails.
- The Neckline: This is the make-or-break level. It’s a support line drawn connecting the low points on both sides of the cup. When the price breaks decisively below this neckline, it’s the confirmation you’re looking for. It signals that sellers are officially in charge, and the downtrend is likely beginning.
Understanding how these three parts work together is your first step to turning this chart pattern into a real trading strategy. When all the elements align perfectly, the reverse cup and handle pattern becomes a screaming sign that the market's direction is about to shift.
The Market Psychology Behind the Pattern

To really trade the reverse cup and handle pattern well, you have to get inside the market's head. This isn't just a random shape on a chart; it’s a story about the tug-of-war between buyers (the bulls) and sellers (the bears). Every part of the pattern shows you a critical shift in who has control.
It all starts after a nice, strong uptrend where the bulls have been running the show. But as the price begins to curve over into that rounded top, the bullish optimism starts to fade. This slow, arching peak is your first clue that buyers are getting tired and selling pressure is quietly building. It's not a sudden crash, but a gradual, grinding transfer of power.
The Fading Hope of the Bulls
As the price rolls over and heads down the right side of the "cup," sellers are now clearly in charge. The handle that forms next is the bulls' last gasp—a final, weak attempt to push the price back up. Think of this brief rally as the market taking one last breath before the real plunge begins.
That handle is the psychological linchpin. When it fails to make a new high, it’s a massive red flag. It’s the market telling you the buyers have shot their last shot and have nothing left in the tank. The low trading volume during the handle's formation seals the deal, confirming a total lack of conviction from the bulls.
When the handle forms and ultimately fails, it’s the market’s way of screaming that the bullish momentum is dead and gone. The breakdown that follows is the final nail in the coffin, confirming that sellers have won the fight and are ready to take prices lower.
The Bearish Confirmation and Breakdown
The real drama happens when the price breaks decisively below the neckline. This isn't just a technical event—it's a massive psychological blow to anyone still hoping for higher prices. That breakdown triggers a flood of sell orders as long traders are forced to dump their positions, which only adds fuel to the fire.
This is where volume becomes your best friend. A true breakdown almost always comes with a huge spike in trading volume. Market psychology is what drives this; the break confirms the market has flipped from optimistic to pessimistic. That volume surge can be significant, with some analyses showing it can jump 30-50% above average. It's a clear signal of panicked selling and firm bearish control. You can see more on how volume acts as a confirmation tool in this inverse cup and handle guide from fxopen.com.
Once you learn to read this story, you stop just seeing shapes and start understanding the market's emotional state. That's the difference between being a reactive trader and a proactive one.
How to Reliably Identify This Bearish Signal
Let’s get one thing straight: not every U-turn on a chart is a genuine reverse cup and handle pattern. I’ve seen countless traders get burned by jumping on what looks like the real deal, only for it to be market noise. To avoid those costly false alarms, you need a disciplined eye and a non-negotiable checklist.
First thing’s first: context is king. This pattern only has teeth if it shows up after a clear and significant uptrend. If the market is just chopping sideways, any little "n" shape that forms is probably meaningless. It doesn't carry the psychological weight of a real trend reversal. You need to know the bigger picture, and if you’re unsure, our guide on how to identify market trends is a great place to start.
Core Identification Criteria
Okay, so you've confirmed the preceding uptrend. Now, we zoom in on the pattern’s anatomy.
The "cup" itself needs to be a nice, rounded top. Think smooth dome, not a sharp, V-shaped peak. That gradual rollover tells a story: buying pressure is slowly and methodically drying up. A sudden, panicked spike is a different beast entirely and far less reliable for this setup.
Next up is the "handle." This is the small, corrective rally that follows the cup. It should be orderly and, crucially, shallow. I look for a handle that retraces no more than one-third of the cup’s total depth. If it pushes too far back up, it’s a red flag that buyers are still in the fight, which often invalidates the entire bearish case.
Finally, draw your line in the sand—the neckline. This should be a relatively clean, horizontal support level that connects the low points on either side of the cup. If the neckline is messy or sharply angled, it’s tough to pinpoint a clear breakout level, making the signal weak and unreliable.
This quick visual guide really hammers home the key checkpoints you need to validate the pattern.
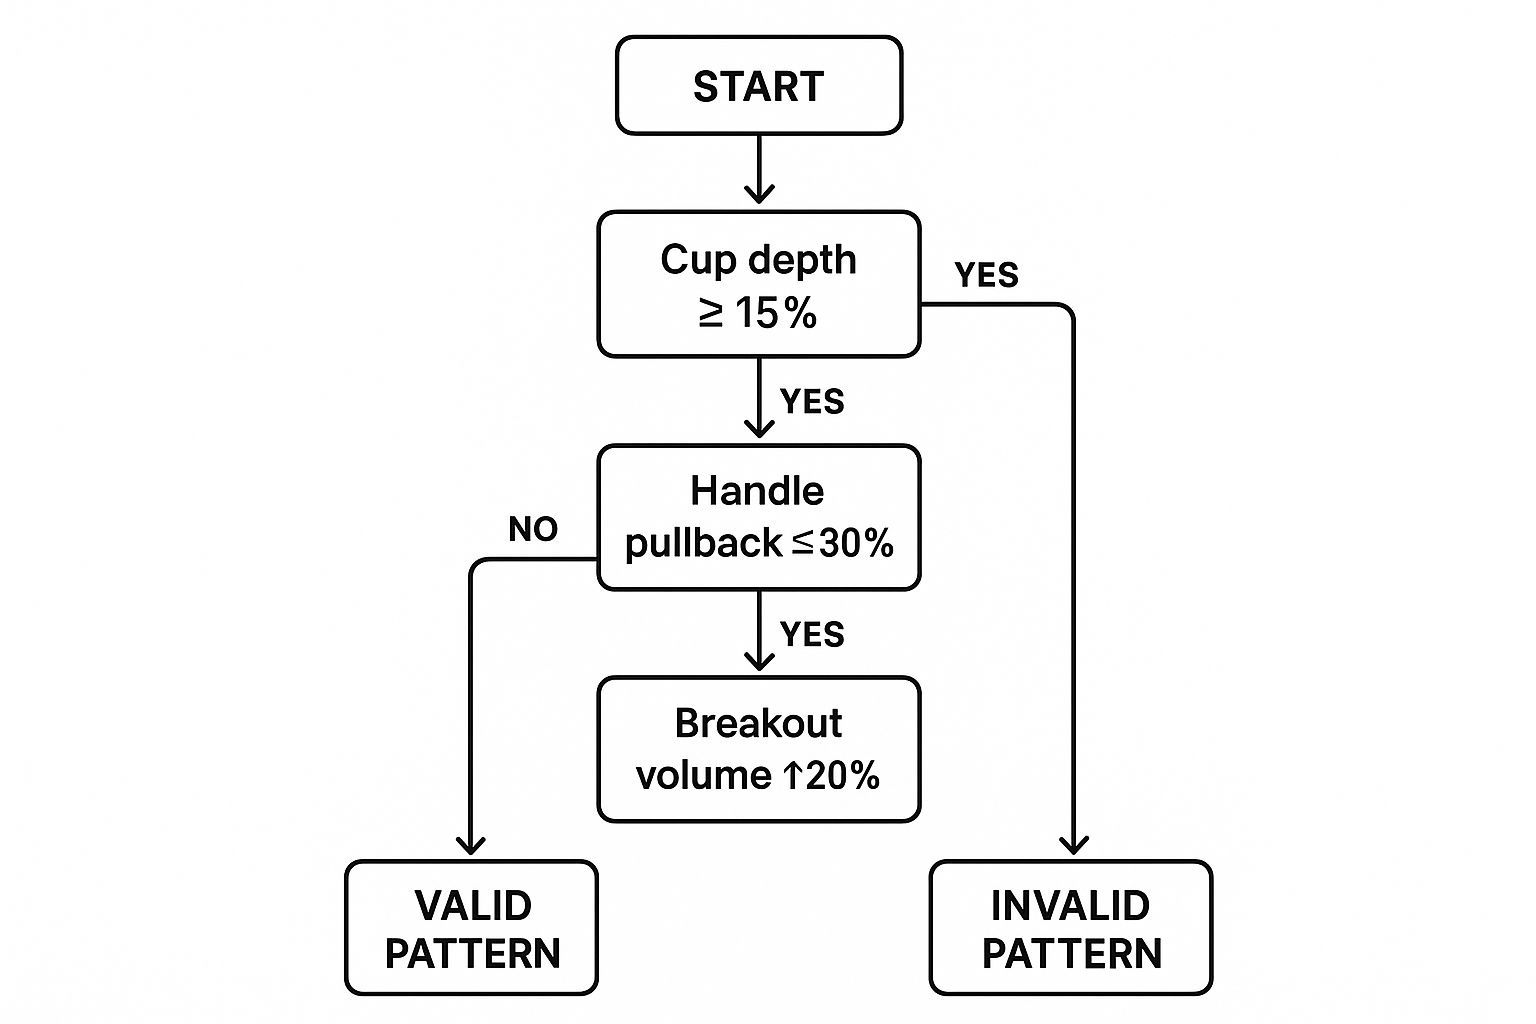
As you can see, a failure at any one of these steps—from the shape of the cup to the depth of the handle or the volume on the breakout—is enough for me to pass on the trade.
Valid vs. Invalid Reverse Cup and Handle Pattern
To really drive this home, let's put a textbook setup side-by-side with a dud. The most profitable traders I know are incredibly picky. They reject any pattern that doesn't meet every single one of their criteria. This discipline is what separates the pros from the crowd chasing every flicker on the screen.
The table below is your cheat sheet for telling a high-probability setup from a costly look-alike. Use it as a final mental check before you even think about putting capital at risk.
| Characteristic | Valid Pattern (High-Probability) | Invalid Pattern (Low-Probability) |
|---|---|---|
| Prior Trend | Must follow a clear, established uptrend. | Forms in a sideways, choppy, or non-trending market. |
| Cup Shape | Smooth, rounded, symmetrical dome shape. | Sharp, V-shaped peak or an asymmetrical, messy top. |
| Handle Formation | Orderly, shallow pullback or slight drift upward. | Retraces more than 1/3 of the cup's depth; looks too strong. |
| Neckline | A clear, horizontal support level is formed. | Sloppy, angled, or poorly defined support line. |
| Volume | Tends to diminish during the cup and handle formation. | Volume is erratic or remains high, showing no sign of buyer exhaustion. |
Sticking to only the patterns that tick every box in the "Valid" column is how you stay out of bad trades and wait for the A+ opportunities. It's a game of patience.
A Complete Strategy for Trading the Pattern
Spotting a clean reverse cup and handle pattern is only half the job. Knowing exactly how to trade it is what separates the consistently profitable traders from everyone else. You need a solid plan to take the emotion and guesswork out of the equation, replacing it with a repeatable, structured process.
This strategy boils down to three make-or-break pillars: your entry trigger, your risk management (the stop-loss), and a data-driven profit target.
It all starts with the entry. The single most important trigger is a decisive candle close below the neckline. I can't stress this enough. A simple dip or a long wick poking below that support level is not a signal—it's a classic recipe for getting faked out. You need to see the price close firmly beneath that line. That's your confirmation that sellers have truly wrestled control of the market. An ideal entry will also show a noticeable spike in selling volume, giving you that extra bit of confidence in the breakdown.
Defining Your Entry and Risk
Once you have a valid signal to get in, your very next thought should be managing your risk. Never, ever enter a trade without knowing exactly where you'll get out if you're wrong.
For the reverse cup and handle, the most logical spot for a stop-loss order is just above the highest point of the handle. This placement is brilliant for two reasons:
- It invalidates the pattern: If the price reverses and punches through the handle's peak, the bearish setup has failed. Your stop-loss gets you out immediately, preventing further damage.
- It keeps your risk defined: The distance between your entry point and your stop-loss is your maximum potential loss on this trade. This lets you calculate your position size like a professional.
This disciplined approach to risk is everything. For traders who are still getting the hang of technical analysis, learning to read what the candles are telling you is a huge step. You can build that skill with our foundational guide on candlestick patterns for beginners to get more confident in spotting those powerful entry signals.
Setting a Logical Profit Target
With your entry and stop-loss set, the final piece of the puzzle is knowing when to cash in. The beauty of this pattern is that it gives you a built-in method for estimating a logical price target, which helps you fight the temptation to exit too early or hang on for too long.
The classic method for setting a profit target is to measure the depth of the inverted cup—from its highest peak down to the neckline—and then project that same distance downward from the breakout point. This gives you a calculated objective for the move.
This measurement is a key statistical tool traders lean on. You calculate the vertical distance from the inverted cup’s peak to the support level (the neckline), and then subtract that same distance from where the price broke down. It’s a simple way to quantify a price objective and manage the trade.
But remember, this is all about confirmation. The pattern is considered failed if the price breaks below support but then quickly rallies back above the handle's low. You can dive deeper into these technical trading nuances on newtrading.io.
By combining a confirmed entry, a tight stop-loss, and a measured profit target, you turn the reverse cup and handle from a simple chart drawing into a complete, professional trading strategy.
Analyzing Real World Chart Examples

Theory is one thing, but seeing a pattern unfold on a live chart is where the rubber really meets the road. When you start analyzing past charts, you begin to train your eyes to spot these high-probability setups in real time. It's how you move a concept from a textbook diagram into your actual trading plan.
Let’s walk through a few examples to see how the reverse cup and handle behaves in the wild. We'll break down each chart to highlight the components we've covered—the rounded top, the handle, the all-important neckline, and where you'd place your entry, stop-loss, and profit targets. This is how you connect the rules to reality.
A Textbook Example in the Stock Market
Picture a hot tech stock that's been flying high for months. Suddenly, the momentum fades. The price action slows down and starts carving out a wide, rounded peak over several weeks. That’s our inverted cup.
Following this gradual rollover, the stock musters a weak, low-volume rally for a few days, forming the classic handle. The key here is that this little bounce fails well below the cup's high, which is a big red flag for buyer exhaustion. The bulls are running out of gas.
The neckline forms a clear line in the sand—a horizontal support level connecting the lows of the cup. As a trader, your eyes would be glued to this level. The entry signal flashes when a big, bearish candle closes decisively below that neckline, ideally with a noticeable spike in trading volume.
- Entry: You'd initiate a short position right on the close below that neckline.
- Stop-Loss: To protect your capital, the stop-loss goes just above the highest point of the handle. This gets you out if the breakdown was a fakeout.
- Profit Target: The target is calculated by measuring the depth of the cup (from its highest peak down to the neckline) and projecting that same distance downward from the breakout point.
In a perfect-world scenario like this, the price would follow the script and cascade down to hit your profit target, resulting in a clean, successful trade.
Analyzing a Failed Pattern
Of course, not every pattern plays out perfectly. In fact, studying the failures is just as crucial as celebrating the wins. A failed pattern is your best trading coach for risk management, hammering home the non-negotiable rule that no setup is a sure thing.
Let's imagine a forex pair, say EUR/USD, forming what looks like a beautiful reverse cup and handle on a 4-hour chart. The rounded top is there, the handle is shallow, and the neckline is well-defined. The price breaks below the neckline, and you enter a short position, expecting a slide.
A failed pattern is not a mistake—it is critical market feedback. It shows you precisely where the bearish conviction faltered and why a pre-set stop-loss is the most important tool you have.
But there's a subtle warning sign: the breakout happens on surprisingly low volume. Instead of gathering steam and falling further, the price just sort of lingers below the neckline for a few candles. Then, out of nowhere, a strong bullish bar rips price back up, not just above the neckline but also blowing past the high of the handle.
This move would immediately trigger your stop-loss, closing the position for a small, manageable loss. The failure here tells a story: the bears didn't have the muscle to follow through, and the bulls were waiting to ambush them and reclaim control.
Automate Your Strategy with Trading Made Easy
When you're staring at a chart, trying to time a pattern like the reverse cup and handle, every second counts. You need speed, you need precision, and most of all, you need to stick to your plan. At Trading Made Easy, we've focused on one thing since 2014: giving traders the tools to take the guesswork and manual labor out of executing their strategies.
Our automated day trading software is built to eliminate hesitation and emotional interference. You set the rules for patterns like the reverse cup and handle, and it acts instantly, executing your trade the moment your criteria are met. No second-guessing, just pure execution.
Execute with Confidence and Precision
Our software is the bridge between your analysis and your results. Here are its key features and benefits:
- Emotion-Free Execution: It acts on your pre-set rules for entry, stop-loss, and take-profit. This removes fear and greed from the equation, ensuring disciplined trading.
- Lightning-Fast Speed: In volatile markets, our software identifies and acts on setups far faster than a human ever could, which is critical for capitalizing on explosive moves.
- Unwavering Discipline: The system becomes your perfect trading partner, enforcing your strategy flawlessly. It guarantees you only take the high-quality setups you’ve defined ahead of time.
We have seen countless traders achieve new levels of consistency with our software. One user, who used to struggle with the emotional stress of watching a reverse cup and handle pattern form, now simply sets the parameters and lets the technology do the work. His results improved dramatically, simply by removing the temptation to exit good trades early or chase bad ones.
This systematic approach is a cornerstone of long-term success. Learning more about building an automated trading system is the perfect next step to applying these principles to your own trading.
Frequently Asked Questions
When you're digging into technical analysis, it's natural for questions to pop up. Let's tackle some of the most common ones about the reverse cup and handle pattern so you can approach it with more confidence and a clearer game plan.
What Is the Main Difference Between a Regular and Reverse Cup and Handle?
Think of them as mirror images, each telling you the opposite story about where the market might be headed.
The regular cup and handle is a classic bullish pattern. It carves out a "U" shape (the cup) and then a small dip (the handle). This signals that the market is just taking a breather before likely continuing its climb. It's basically a launchpad for higher prices.
The reverse cup and handle, on the other hand, is its bearish twin. It looks like an upside-down "n" (the inverted cup) followed by a short-lived rally (the handle). This formation is a warning sign, suggesting a major trend change from up to down is on the cards. It's less of a launchpad and more of a ledge prices could fall from.
How Important Is Volume for Confirmation?
It’s not just important—it’s absolutely critical. Without the right volume signals, you're just looking at a shape on a chart, not a high-probability trade setup. Volume is the lie detector test for the pattern.
As the inverted cup and handle take shape, you ideally want to see trading volume dry up. This tells you the buyers are losing steam. But the real moment of truth is the breakdown. You need to see a massive, undeniable surge in selling volume as the price slices through the neckline.
A breakdown on weak or fizzling volume is a huge red flag. It often means there isn't real conviction behind the selling, dramatically increasing the odds of a fakeout that whipsaws you out of a trade.
What Should I Do If the Pattern Fails?
Listen, every single trader, no matter how seasoned, deals with failed patterns. It's not a personal failure; it's just the market being the market. This is exactly why a rock-solid risk management plan isn't optional.
A failure usually looks like this: the price breaks below the neckline, but instead of continuing down, it quickly reverses and shoots back up above the high of the handle. This is the market telling you the bears couldn't seal the deal and the bulls have wrestled back control.
Your reaction should be automatic. Your pre-placed stop-loss order—set just above the handle's peak—should trigger and get you out of the trade. A failed pattern is just valuable feedback from the market telling you to step aside and protect your capital.
Which Timeframes Work Best for This Pattern?
You can spot the reverse cup and handle on pretty much any timeframe, from the 5-minute charts that day traders live on to the weekly charts used by long-term investors. That said, the pattern's reliability and impact tend to grow with the timeframe.
A pattern that forms over several weeks or months on a daily or weekly chart simply carries more weight. Why? Because it reflects the decisions and sentiment of a much larger group of people over a longer stretch of time. While it's definitely useful for short-term moves, the most powerful and sustained downtrends often begin with patterns formed on these higher timeframes.
Mastering patterns like the reverse cup and handle is a crucial step, but consistent execution is what truly makes a difference. At Trading Made Easy, we provide the tools to help you identify and act on these patterns with speed and precision. Our automated platform removes emotion and hesitation, ensuring you execute your strategy flawlessly. Discover how our technology can help you trade more consistently by exploring our offerings at https://tradingmadeasy.com.
Leave a Reply